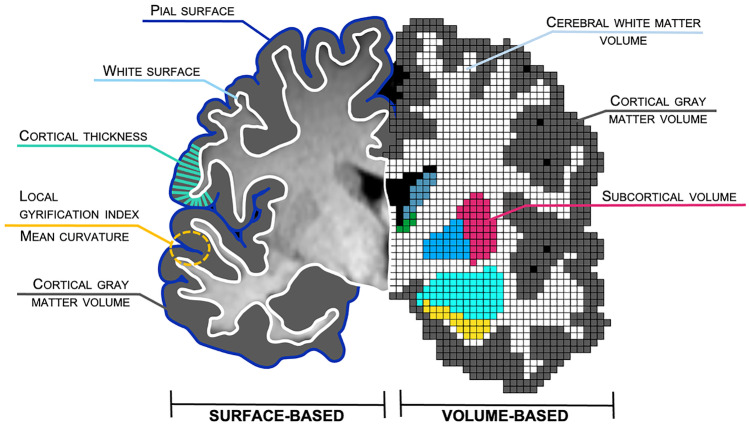
Fig. 1.
Overview of structural brain metrics. Coronal slice of an individual brain indicating metrics according to the surface-based (left) and volume-based (right) processing streams as implemented in FreeSurfer. Depicted are the subcortical structures nucleus caudatus (blue-gray), thalamus (green), putamen (magenta), globus pallidus (deep sky blue), amygdala (cyan), and hippocampus (yellow). Black represents cerebrospinal fluid. Corpus callosum and ventricles are not labeled. For illustration purposes, the graphic and scaling was simplified and does not claim anatomical correctness. Figure courtesy of Anna Backhausen

