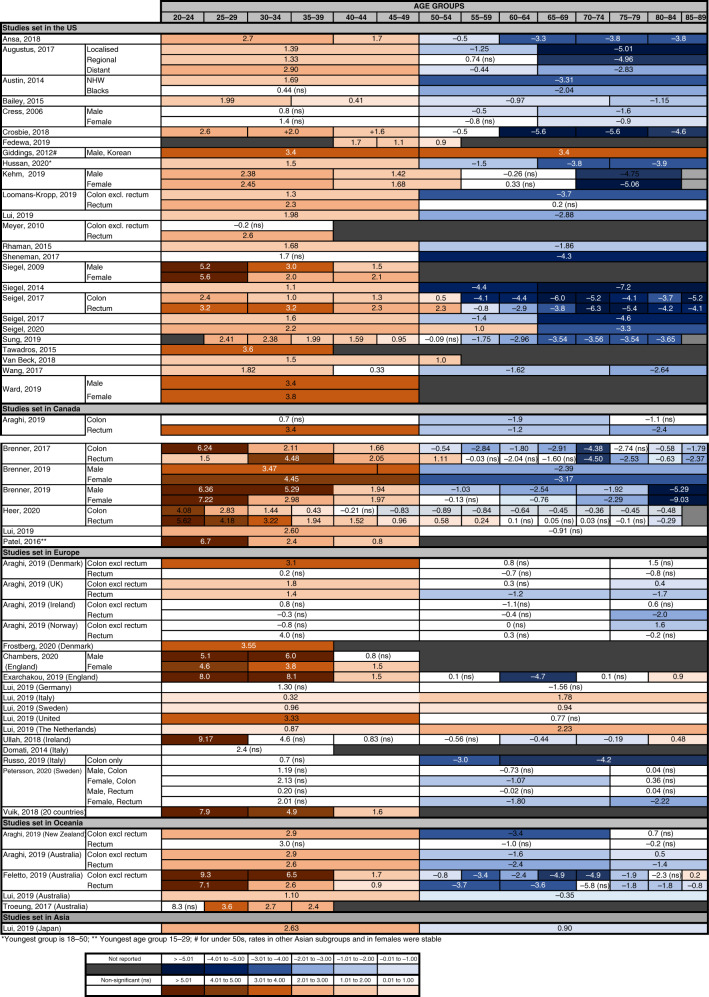
Fig. 2. Recent trends in the incidence of colorectal cancer.
Annual percentage changes (APC) in incidence are reported by age group. Increases are indicated in red and decreases in blue, with darker colours corresponding to greater changes. Stable incidences are indicated in white. For simplicity, the unstratified APC is reported, when available. For studies where the unstratified APC was not available, APC is stratified by anatomical location, histological type, gender and/or two main ethnicities (Black and NHW, non-Hispanics White). When APC values were available for several time periods, only the most recent APC is included. For some studies, the upper age limit for the oldest group and the lowest age limit for the younger group were not reported in the original study. Detailed information of the time periods and age groups covered by the different studies is reported in Supplementary Table 2. The following references are not included in the figure as they cover a large number of countries: Lu et al. [9] (20 countries worldwide), Siegel et al. [7] (36 countries worldwide).

