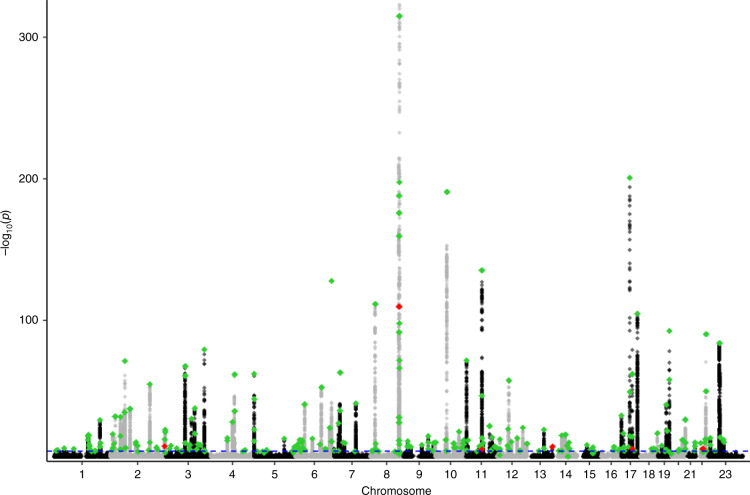
Fig. 3. Manhattan plot using the trans-ancestry GWAS January 2021 [65].
The chromosomes are numbered 1–23 in alternating black and grey. The blue dotted line represents genome-wide significance p < 5 × 10⁻⁸. The green dots represent the 269 known PrCa susceptibility loci hits in the multi-ethnicity group. The red dots represent the hits reaching a significant level for AFR but not for EUR. Six regions have specific signals for the AFR population.

