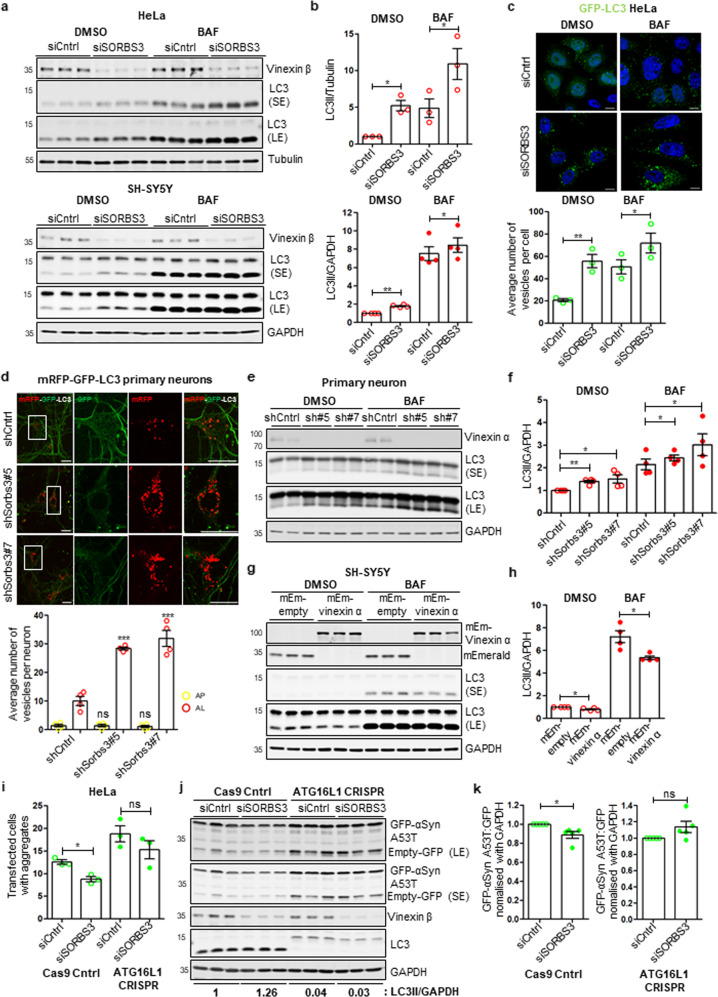
Fig. 1. Vinexin negatively regulates autophagy.
a HeLa and SH-SY5Y cells were depleted of vinexin beta using an individual siRNA oligonucleotide against SORBS3 (siSORBS3; oligo 7). Cells were incubated with bafilomycin A1 (BAF; 400 nM) or DMSO vehicle control for 4 h. Endogenous tubulin, GAPDH, LC3 and vinexin beta protein levels were examined by western blotting. Representative blots from three or four independent experiments per cell line are shown. SE = short exposure; LE = long exposure; molecular weights shown in kDa. b Quantification of 3 (HeLa) or 4 (SH-SY5Y) independent experiments per cell line. LC3-II (lower band of LC3 doublet) levels are expressed relative to loading control (tubulin or GAPDH) and normalised to LC3-II/tubulin or LC3-II/GAPDH in control siRNA (siCntrl) treated cells. * = p < 0.05; ** = p < 0.01 by two-tailed paired t-test. Error bars indicate SEM. c HeLa cells stably expressing GFP-LC3 were depleted of vinexin beta as in a. Cells were treated with BAF (400 nM) or DMSO vehicle control for 4 h. GFP-LC3 was examined by confocal microscopy. Representative images from 3 independent experiments are shown. Green = GFP; blue = DAPI. Scale bars indicate 10 µm. (bottom) GFP-LC3 puncta from the experiments described in c. were counted manually from confocal microscopy images. Quantification of three independent experiments is shown. * = p < 0.05; ** = p < 0.01 by two-tailed paired t test. Error bars indicate SEM. d (top) Mouse primary cortical neurons from mRFP-GFP-LC3 (tfLC3) transgenic mice were infected with either control shRNA (shCntrl) or shRNA against Sorbs3 (shRNA Sorbs3 #5 or #7) lentiviral vector. Scale bars indicate 20 µm. Representative images from four independent experiments are shown. (bottom) Manual quantification of GFP/mRFP-double positive vesicles (autophagosomes; AP) and mRFP-only vesicles (autolysosomes; AL) from the representative experiment shown in d. Autophagosomes and autolysosomes were first identified as mRFP positive vesicles. mRFP positive vesicles that overlapped with GFP positive vesicles were then counted as autophagosomes, while vesicles that were only positive for mRFP were counted as autolysosomes. In total, 25–35 cells analysed per condition per experiment in four independent experiments. ns = p > 0.05; *** = p < 0.001 by two-tailed Student’s t test. e Mouse primary cortical neurons from wild-type mice were infected with either control or Sorbs3 shRNA (sh#5 or sh#7) lentiviral vector. Infected cells were incubated with either DMSO or bafilomycin A1 (BAF; 400 nM) for 4 h. Endogenous LC3, GAPDH, and vinexin alpha protein levels were examined by western blotting. Representative blot from four independent experiments is shown. SE = short exposure; LE = long exposure; molecular weights shown in kDa. f Quantification of four independent experiments. LC3-II levels are expressed relative to GAPDH loading control and normalised to LC3-II/GAPDH in control shRNA (shCntrl) infected cells. * = p < 0.05; ** = p < 0.01 by two-tailed paired t-test. Error bars indicate SEM. g SH-SY5Y cells were transfected with either mEmerald-empty (mEm-empty) or mEmerlad-vinexin alpha (mEm-vinexin α). Transfected cells were treated with bafilomycin A1 (BAF; 400 nM) or DMSO vehicle control for 4 h. mEmerald, mEmerald-vinexin alpha, GAPDH and LC3 protein levels were examined by western blotting. Representative blots from 4 independent experiments per cell line are shown. SE = short exposure; LE = long exposure; molecular weights shown in kDa. h Quantification of four independent experiments. LC3-II levels are expressed relative to GAPDH loading control and normalised to LC3-II/GAPDH in control mEmerald-empty (mEm-empty) transfected cells. * = p < 0.05 by 2-tailed paired t-test. Error bars indicate SEM. i Autophagy-competent (Cas9 Cntrl) and autophagy-deficient (ATG16L1 CRISPR) HeLa cells were depleted of vinexin beta using an individual siRNA oligonucleotide against SORBS3 (siSORBS3; oligo 7). Cells were transfected with an aggregate-prone GFP-tagged huntingtin exon 1 fragment containing 74 glutamine repeats [GFP-Htt (Q74)] for 48 h. GFP-positive (total transfected) cells and cells with GFP-Htt aggregates were counted manually by fluorescence microscopy and the percentage of the total transfected cells with aggregates was calculated. n ≥ 600 transfected cells per condition. Quantification of three independent experiments is shown. ns = p > 0.05; * = p < 0.05 by two-tailed paired t-test. Error bars indicate SEM. j Cas9 Cntrl and ATG16L1 CRISPR HeLa cells were depleted of vinexin beta as in a, then transfected with both EGFP-tagged mutant alpha-synuclein (pEGFP-A53T α-syn) and pEGFP-empty vector (Empty-GFP). EGFP, EGFP-A53T α-syn, vinexin beta, GAPDH and LC3 protein levels were examined by western blotting. LC3-II/GAPDH protein levels are indicated below the corresponding lanes. Representative blot from five independent experiments per cell line is shown. SE = short exposure; LE = long exposure; molecular weights shown in kDa. k Quantification of 5 independent GFP-A53T α-syn degradation assays represented in j. The ratio of GFP-A53T α-syn to GFP level (nomalised to GAPDH) is shown for Cas9 Cntrl (left panel) and ATG16L1 CRISPR (right panel) HeLa cells. ns = p > 0.05; * = p < 0.05 by two-tailed paired t-test. Error bars indicate SEM.

