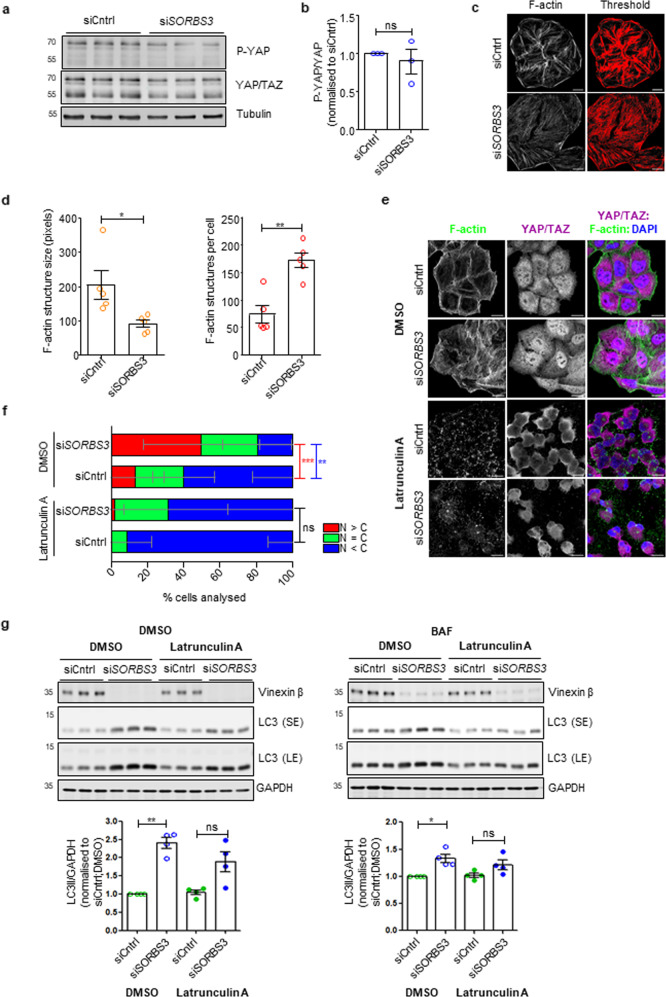
Fig. 3. Vinexin depletion upregulates YAP/TAZ through a Hippo pathway-independent, filamentous actin-dependent mechanism.
a HeLa cells were depleted of vinexin beta using an individual siRNA oligonucleotide against SORBS3 (siSORBS3; oligo 7). Endogenous total YAP/TAZ, YAP phosphorylated at serine 127, tubulin and vinexin beta protein levels were examined by western blotting. Representative blot from three independent experiments is shown. Molecular weights in kDa. b Quantification of three independent experiments. P-YAP and YAP (upper band of YAP/TAZ doublet) are expressed relative to tubulin loading control, the ratio of P-YAP/tubulin: YAP/tubulin taken and then normalised to P-YAP/YAP in siCntrl treated cells. ns = p > 0.05 by two-tailed paired t-test. Error bars indicate SEM. c. HeLa cells were depleted of vinexin beta as in a. Endogenous filamentous actin (F-actin) was visualised using Alexa Fluor 488-conjugated phalloidin and confocal microscopy. Confocal images (F-actin) were analysed using ImageJ software; F-actin structures were identified by thresholding (threshold). Representative images from five independent experiments are shown. Scale bars indicate 20 µm. d Quantification of F-actin structures per cell and F-actin structure size (pixels) from five independent experiments described in c. * = p < 0.05; ** = p < 0.01 by two-tailed paired t-test. Error bars indicate SEM. e HeLa cells were depleted of vinexin beta as in a. Cells were treated with latrunculin A (0.5 μM) or DMSO vehicle control for 6 h. Endogenous F-actin was visualised using Alexa Fluor 488-conjugated phalloidin and YAP/TAZ was examined by immunofluorescence. Representative confocal images from three independent experiments are shown. Green = F-actin (Alexa Fluor 488); purple = YAP/TAZ (Alexa Fluor 647); blue = DAPI. Scale bars indicate 20 µm. f Cells with predominantly nuclear YAP/TAZ (N > C), YAP/TAZ equally distributed between nucleus and cytosol (N = C) and predominantly cytosolic YAP/TAZ (C > N) where manually quantified. Quantification of the representative experiment shown in a. ns = p > 0.05; ** = p < 0.01; *** = p < 0.001 by two-tailed Student’s t-test. Red asterisks represent p value for N > C; blue asterisks represent N < C p value. n = 122 (siCntrl; DMSO); 75 (siSORBS3; DMSO); 165 (siCntrl; latrunculin A); 96 (siSORBS3; latrunculin A). Error bars indicate SD. g (top) HeLa cells were depleted of vinexin beta as in a. Cells were treated with latrunculin A (0.5 μM) or DMSO vehicle control for 2 h and then incubated with BAF (400 nM) or DMSO vehicle control for 4 h (total of 6 h treatment with latrunculin A or DMSO in the presence or absence of BAF). Endogenous GAPDH, LC3 and vinexin beta protein levels were examined by western blotting. Representative blots from four independent experiments are shown. SE = short exposure; LE = long exposure; molecular weights shown in kDa. (bottom) Quantification of four independent experiments described in g. LC3-II (lower band of LC3 doublet) levels are expressed relative to GAPDH loading control and normalised to LC3-II/GAPDH in DMSO treated siCntrl cells. * = p < 0.05; ** = p < 0.01 by two-tailed paired t-test. Error bars indicate SEM.

