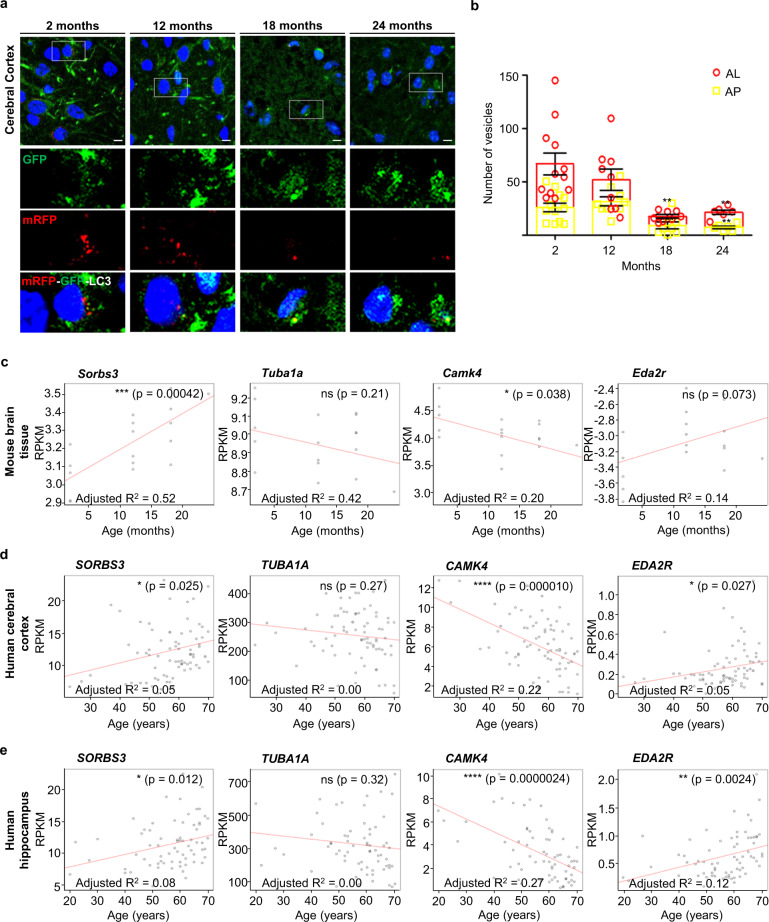
Fig. 5. Autophagy declines with age in mouse motor cortex, corresponding to increased SORBS3 mRNA expression in mouse and human brain tissue.
a Representative confocal images of sections of mouse motor cortex obtained from GFP-mRFP-LC3 mice aged to 2, 12, 18 and 24 months. b Manual quantification of autolysosomes (AL) and autophagosomes (AP) in the motor cortex of 2 (n = 12), 12 (n = 9), 18 (n = 8) and 20–24 (n = 3) months old GFP-mRFP-LC3 mice. Autophagic vesicles (autophagosomes and autolysosomes) were first identified as mRFP positive vesicles. mRFP positive vesicles that overlapped with GFP positive vesicles (GFP/mRFP-double positive vesicles) were counted as autophagosomes, while vesicles that were only positive for mRFP (mRFP-single positive vesicles) were counted as autolysosomes. ** = p < 0.01, *** = p < 0.001 by two-tailed Student’s t-test. Error bars indicate SEM. c Sorbs3 mRNA expression, Camk4 mRNA expression (positive control), Eda2r mRNA expression (positive control) and Tuba1a mRNA expression (negative control) determined by RNA sequencing of samples from wild-type mouse brain tissue (combined motor cerebral cortex, somatosensory cerebral cortex and striatum) plotted against chronological age of the animals in months. The adjusted coefficient of determination (adjusted R2) is displayed to two significant figures on the scatter plot (bottom left). Overall significance of the regression analysis was established by F-test and the p value displayed to two significant figures on the scatter plot (top right). * = p < 0.05, ** = p < 0.01, *** = p < 0.001, **** = p < 0.0001 by F-test. n = 18. RPKM = Reads Per Kilobase of transcript per Million. d SORBS3 mRNA expression, CAMK4 mRNA expression (positive control), EDA2R mRNA expression (positive control) and TUBA1A mRNA expression (negative control) determined by RNA sequencing of samples from ‘neuropathological normal’ human frontal cerebral cortex plotted against chronological age of the donors in years. Adjusted R2 is displayed to two significant figures (bottom left) and p value displayed to two significant figures (top right), as in c. n = 77. e SORBS3 mRNA expression, CAMK4 mRNA expression (positive control), EDA2R mRNA expression (positive control) and TUBA1A mRNA expression (negative control) determined by RNA sequencing of samples from ‘neuropathological normal’ human hippocampus were plotted against chronological age of the donors in years. Adjusted R2 is displayed to two significant figures (bottom left) and p value displayed to two significant figures (top right), as in c. n = 70.

