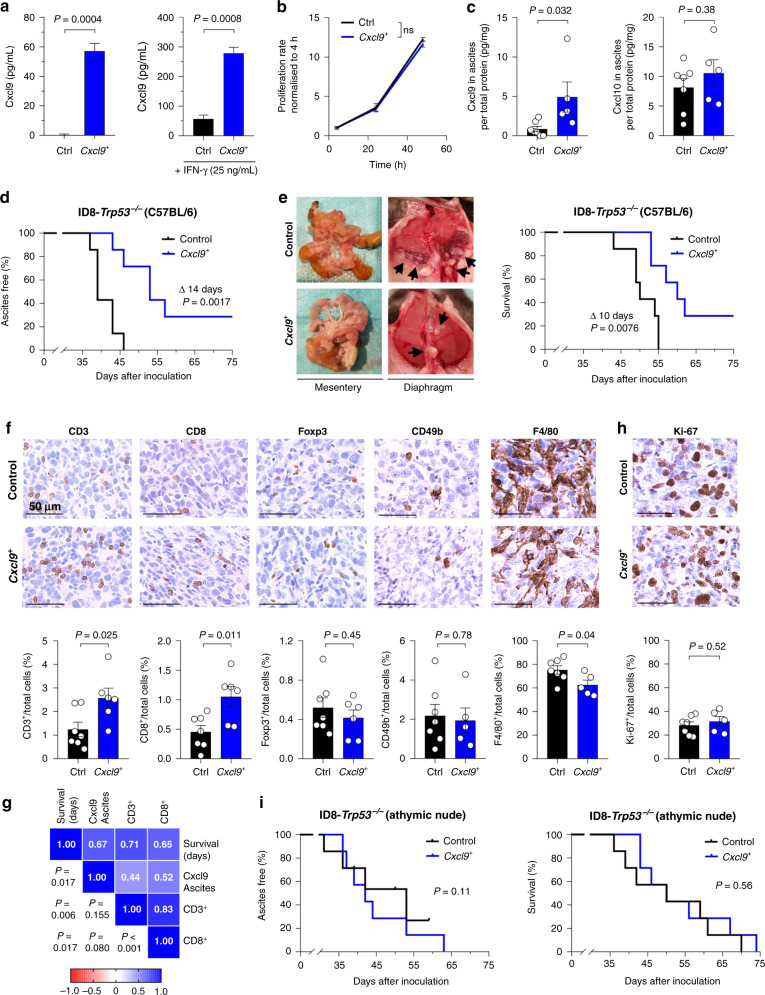
Fig. 1. Overexpression of Cxcl9 significantly improves survival in vivo, dependent on the adaptive immune system.
a Soluble Cxcl9 was measured in cell supernatants of ID8-Trp53-/-Control (Ctrl) and ID8-Trp53−/−Cxcl9+ (Cxcl9+) cells after 48 h ± IFN-γ (25 ng/mL) stimulation by ELISA (n = 3). b Proliferation rates of ID8-Trp53−/−Control and Cxcl9+ cells were measured via MTT assay and normalised to the baseline value at 4 h (n = 3). c–g In all, 1 × 10⁷ ID8-Trp53−/− Control or Cxcl9+ cells were intraperitoneally inoculated into C57BL/6 mice. c Soluble Cxcl9 or Cxcl10 in murine ascites was determined in ID8-Trp53−/− Control and Cxcl9+ groups by ELISA and normalised to total protein assessed by Bradford assay. d Kaplan–Meier plot showing the time to onset of ascites of animals inoculated with ID8-Trp53−/−Control or Cxcl9+ tumour cells (data representative of two independent experiments). e Representative pictures of reduced diaphragmatic and mesenteric tumour load in ID8-Cxcl9+ compared to control tumour-bearing mice finalised on the same day. Adjacent Kaplan–Meier plot (right) shows overall survival of animals inoculated with ID8-Trp53−/−Control or Cxcl9+ tumour cells (data representative of two independent experiments). f Representative pictures of immunohistochemically stained markers (CD3, CD8, Foxp3, CD49b, F4/80) of intratumoral immune cell populations in ID8-Trp53−/−Control and Cxcl9+ tissue sections (scale bars 50 µm) with corresponding column diagrams of digitally analysed tissue sections below. g Heatmap containing Pearson correlation coefficients and associated significances between survival, ascites Cxcl9 and intratumoral CD3+ or CD8+ relative cell numbers of ID8-Trp53−/− tumours. h Digital analysis of IHC Ki-67-positive proliferating cells within the tumour microenvironment. i In total, 1 × 10⁷ ID8-Trp53−/−Control or Cxcl9+ cells were intraperitoneally inoculated into athymic nude mice. Kaplan–Meier plots showing time to onset of ascites (left) or time to death (right). Bars represent mean ± SEM. Each dot indicates data of one individual mouse. Mouse experiments were conducted with seven mice per group.

