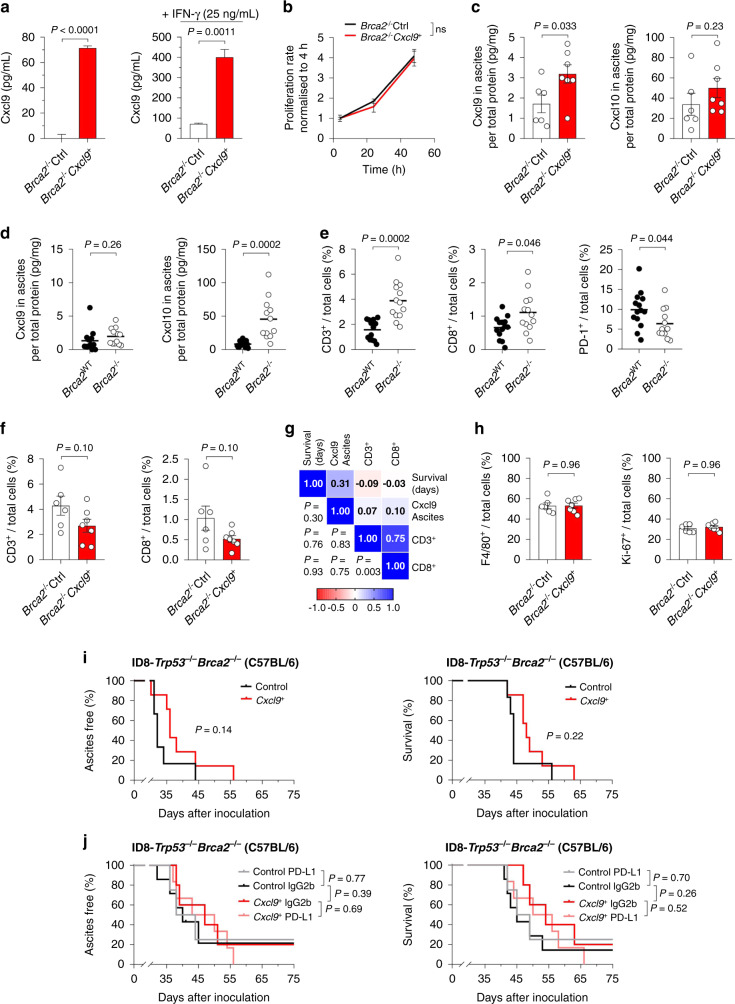
Fig. 3. Cxcl9 loses its ability to suppress tumour growth and to provide ICB responsiveness in a Brca2-deficient mouse model.
a Cxcl9 overexpression was assessed in ID8-Trp53−/−Brca2−/−Control (Brca2−/−Ctrl) and ID8-Trp53−/−Brca2−/−Cxcl9+ (Brca2−/−Cxcl9+) cell supernatants after 48 h stimulation with solvent control (left) or 25 ng/mL IFN-γ (right) by ELISA (n = 3). b Proliferation of Brca2−/−Ctrl and Brca2−/−Cxcl9+ cells was assessed via MTT assay and normalised to 4 h baseline values (n = 3). c Cxcl9 and Cxcl10 concentrations relative to total protein in ascites of ID8-Trp53−/−Brca2−/−Control or Cxcl9+ tumour-bearing mice were calculated via ELISA. d Impact of Brca2 loss-of-function on relative Cxcl9 and Cxcl10 ascites concentrations as determined by ELISA of ascites from tumour-bearing mice. e Number of CD3+, CD8+ and PD-1+ immune cells in wild-type and Brca2-deficient tumours as determined by digital analysis of immunohistochemical stainings. f Relative abundance of CD3+ and CD8+ T cells in ID8-Trp53−/−Brca2−/−Control and Cxcl9+ tumours. g Heatmap correlation matrix showing Pearson correlation coefficients and associated significances between survival, ascites Cxcl9 concentration and intratumoral CD3+ or CD8+ cells of ID8-Trp53−/−Brca2−/− tumours. h Digital IHC analysis of intratumoral F4/80+ and Ki-67+ cells in ID8-Trp53−/−Brca2−/−Control or Cxcl9+ tumours. i Kaplan–Meier plots showing time to ascites formation or overall survival for ID8-Trp53−/−Brca2−/−Control or Cxcl9+ tumour-bearing-mice (at least six mice per group, data representative of two independent experiments). j Kaplan–Meier plots showing time to onset of ascites or overall survival under anti-PD-L1 treatment or IgG2b control, stratified by Cxcl9 overexpression in the Brca2-deficient ID8 model (at least four mice per group). Bars represent mean ± SEM. Each dot represents the data of one individual mouse.

