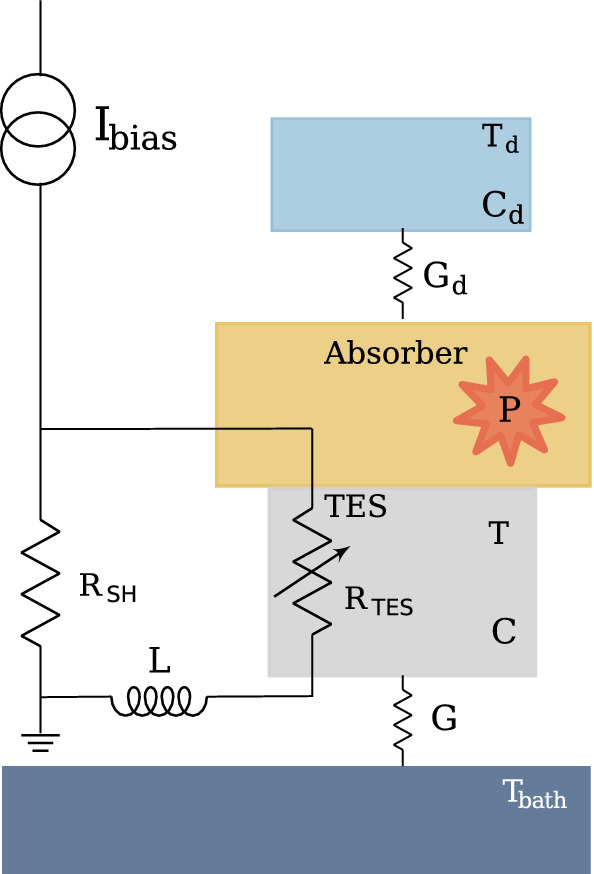
Fig. 2.

Two-body dangling model for HOLMES microcalorimeter pulses simulation. The TES is represented by the gray body, the absorber part of the microcalorimeter where the Ho is implanted is depicted in yellow and the dangling body is illustrated in light-blue. Whenever a Ho decay occurs in the absorber, a release of energy E, corresponding to a power P (depicted in red in the scheme), triggers the microcalorimeter response which depends both on the electric and thermal circuit parameters
