Fig. 3.

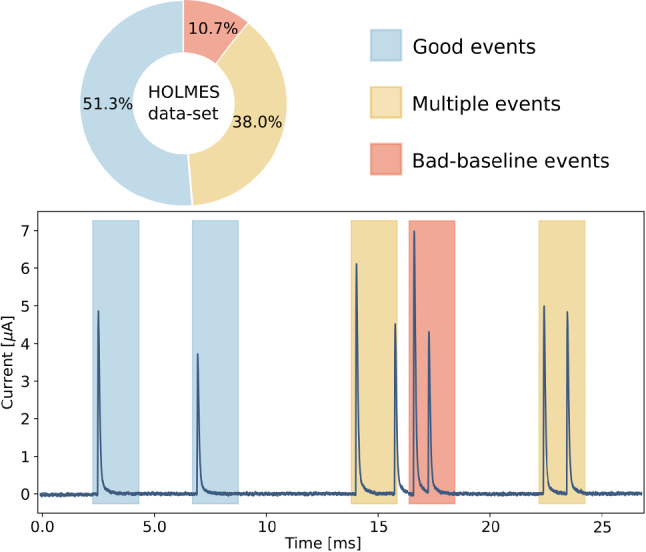
Results of a HOLMES experiment TES simulation: composition of the HOLMES experiment data-set (top); part of raw data flow from a HOLMES microcalorimeter with triggered record windows colored as the classification of the events (bottom)

Results of a HOLMES experiment TES simulation: composition of the HOLMES experiment data-set (top); part of raw data flow from a HOLMES microcalorimeter with triggered record windows colored as the classification of the events (bottom)