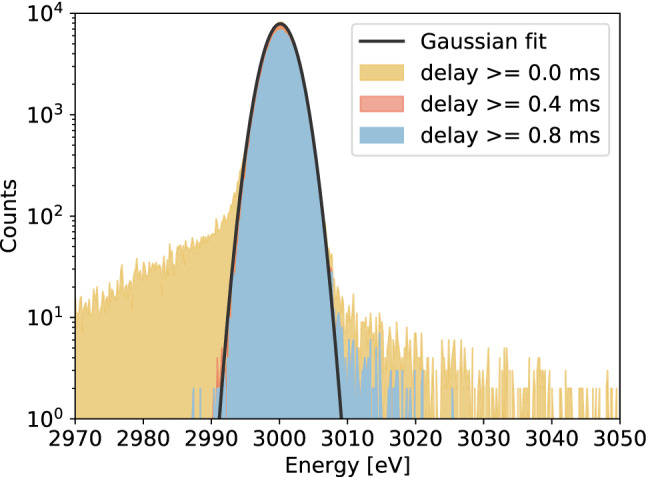
Fig. 6.

Detector responses (R(E)) generated with the application of the matrix filter to different sub-sets of the data-set, by omitting the evaluation of Multi2 events with a delay larger than 1.756 ms. In yellow R(E) obtained with the complete data-set (good plus all bad-baseline and all multiple events), in red R(E) including only bad-baseline and multiple events with delay greater than 0.4 ms and in light-blue R(E) considering those with delay greater than 0.8 ms. The plot also shows the Gaussian fit (in black) of the yellow detector response. The values of the Gaussian parameters from the fit are: mean eV, standard deviation eV and norm
