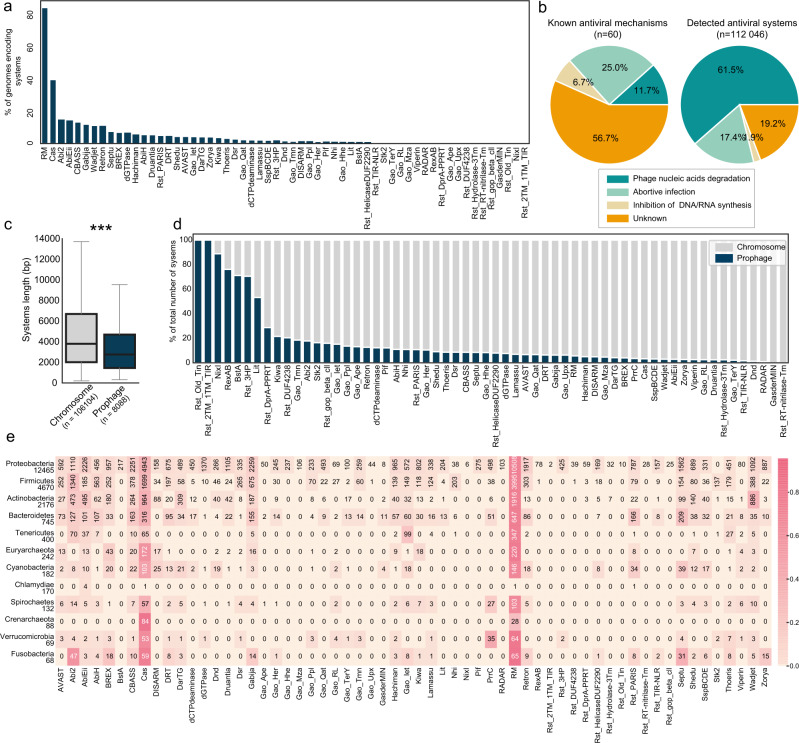
Fig. 3. Families of antiviral systems have a heterogenous distribution.
a Frequency of systems in genomes. b Classification of antiviral mechanisms and detected operons according to their molecular functioning. c System length according to genomic location (***, two sided Wilcoxon test p-value = 6.5e−273)). The box extends from the first quartile (Q1) to the third quartile (Q3) of the data, with a line at the median. The whiskers extend from the box by 1.5× the inter-quartile range (IQR). n chromosome = 106,104, n prophage = 8088. Plasmids were excluded from this analysis. A system was deemed to be part of a prophage when the first and last protein of the system was inside the prophage boundary. The size of a system was computed as the difference between the end of the last protein and the beginning of first protein. d Frequency of genomic location for each system. e Number of systems per prokaryotic phylum. Only phyla with more than 50 genomes are represented. The number of genomes in the dataset is represented under each phylum’s name. The heatmap represents the frequency of each system in a given phylum (per line), color legend on the right. Absolute numbers of genomes encoding a given system is indicated in each cell.

