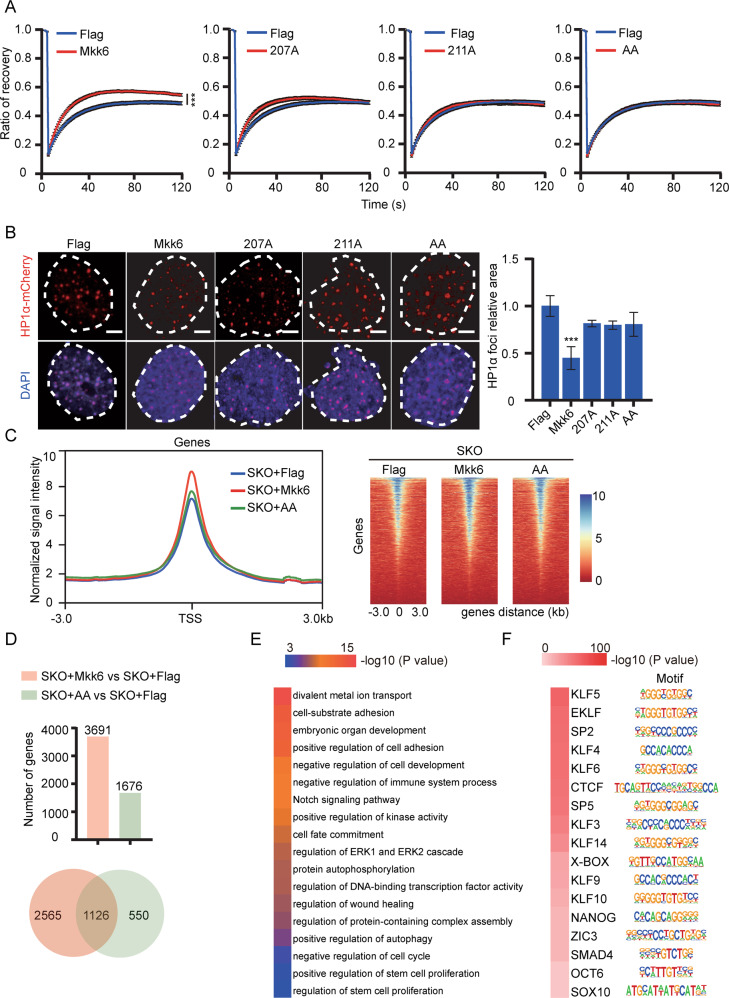
Fig. 1. Mkk6 is a heterochromatin relaxer.
A Fluorescence recovery kinetics of heterochromatin in MEFs infected with Flag, Mkk6 and its mutants. More than 20 cells were analyzed for each group. Data were shown as mean ± SEM. ***p ≤ 0.001. B Immunofluorescence detection of HP1α foci in MEFs transfected with Mkk6 or its mutants. Mkk6, but not 207 A, 211 A or AA mutants, significantly decreased the relative HP1α amount. More than 72 cells were analyzed for each group. Data were shown as mean ± SD. ***p ≤ 0.001. Scale bar: 5 μm. C Metagene plot of ATAC-seq signal in MEFs infected with SKO + Flag, SKO + Mkk6 and SKO + AA. D Number of genes with more accessible chromatin in MEFs infected with SKO + Mkk6 and SKO + AA, compared with SKO + Flag control. Venn diagram depicting overlap between them was shown. E Gene Ontology (GO) analysis for the genes with more accessible chromatin in MEFs infected with SKO + Mkk6 compared with SKO + AA. F Transcription factor motif analysis of genes with more accessible chromatin in MEFs infected with SKO + Mkk6, compared with SKO + AA. The motifs for transcription factors are indicated on the right of the heatmap.

