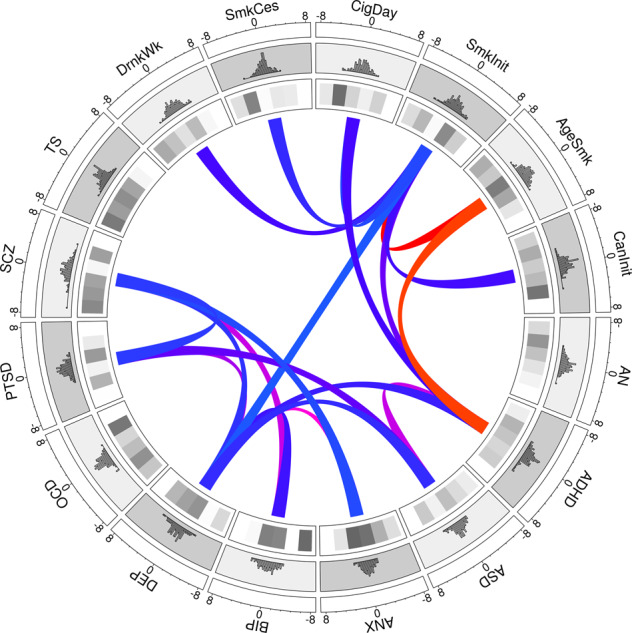
Fig. 4. Circos plot of TWAS Z scores, modular enrichments, and significant transcriptomic correlations across 16 mental health phenotypes.

The outermost layer shows the distribution of TWAS Z scores for each phenotype, while the inner most layer shows the enrichment Z scores for each of the six significant co-expression modules in prefrontal cortex, with darker shading signifying greater enrichment. The inner ribbons represent significant transcriptomic correlations across phenotype pairs, with positive correlations colored blue and negative correlations colored red.
