Fig. 1.
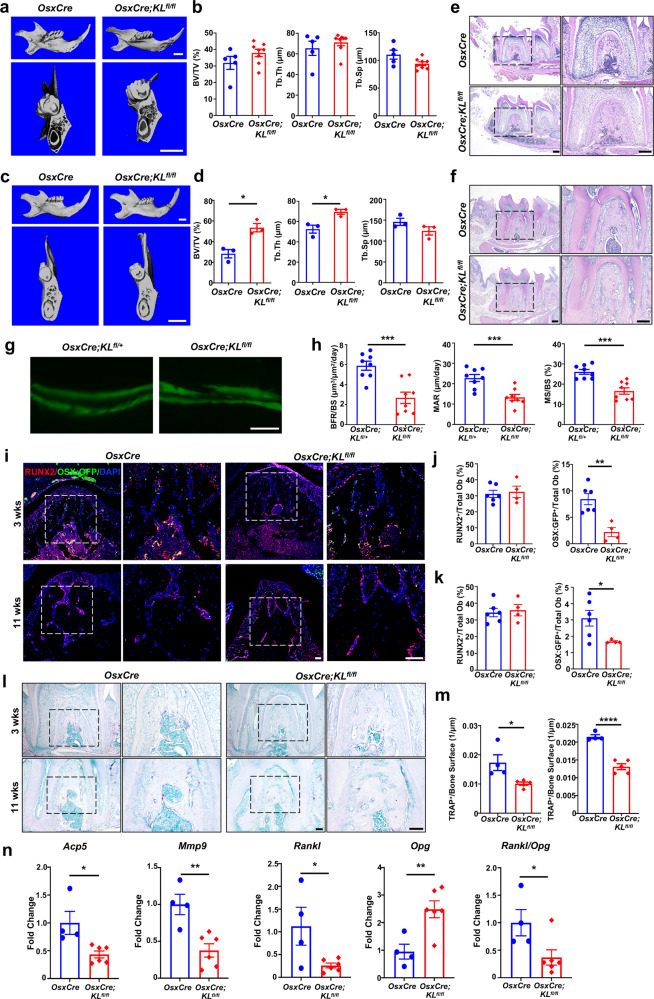
Klotho deficiency in Osx+-cells causes impaired bone remodeling. a, c Three-dimensional reconstruction from micro-computed tomography scans of the alveolar bone of OsxCre;KLfl/fl mice and their control littermates at 3 (a) and 11 weeks old (c). b, d Quantitative analyses of bone volume/tissue volume (BV/TV, %), trabecular thickness (Tb.Th, μm), and trabecular separation (Tb.Sp, μm) in 3- (b, n = 5 in OsxCre group and n = 8 in OsxCre;KLfl/fl group) and 11-week-old mice (d, n = 3). e, f Hematoxylin and eosin (H&E) staining of alveolar bone at root bifurcation of mandibular 1st molar in 3- (e) and 11-week-old mice (f). Higher magnifications of boxed areas show increased alveolar bone mass in OsxCre;KLfl/fl mice. n = 5. g, h Calcein double labeling of alveolar bone from control and OsxCre;KLfl/fl mice. Representative image (g) and quantitative analyses of bone formation rate/bone surface (BFR/BS, μm3/μm2/day), mineral apposition rate (MAR, μm/day) and mineralizing surface/bone surface (MS/BS, %) (h). n = 8. i Double fluorescence staining of RUNX2 and OSX:GFP. Higher magnifications of boxed areas show RUNX2 and OSX:GFP-positive cell distribution at 1st molar root bifurcation. j, k Quantification of RUNX2 or OSX:GFP-positive cells/total osteoblasts in 3- (j) and 11-week-old mice (k). n = 6 in OsxCre group and n = 4 in OsxCre;KLfl/fl group. l TRAP staining. Higher magnifications of boxed areas show the number of TRAP-positive cells decreased in OsxCre;KLfl/fl mice. m Quantification of TRAP-positive cells/bone surface in 3- (left) and 11-week-old mice (right). n = 4 in OsxCre group and n = 5 in OsxCre;KLfl/fl group. n qRT-PCR analysis of Acp5, Mmp9, Rankl, Opg, and Rankl/Opg transcription in 11-week-old mice. n = 4 in OsxCre group and n = 6 in OsxCre;KLfl/fl group. *p < 0.05, **p < 0.01, ***p < 0.001, ****p < 0.0001. All data are shown as the mean ± SEM. Scale bar, 1 mm (a, c), 200 μm (e), 50 μm (g, i), and 100 μm (l)

