Fig. 5.
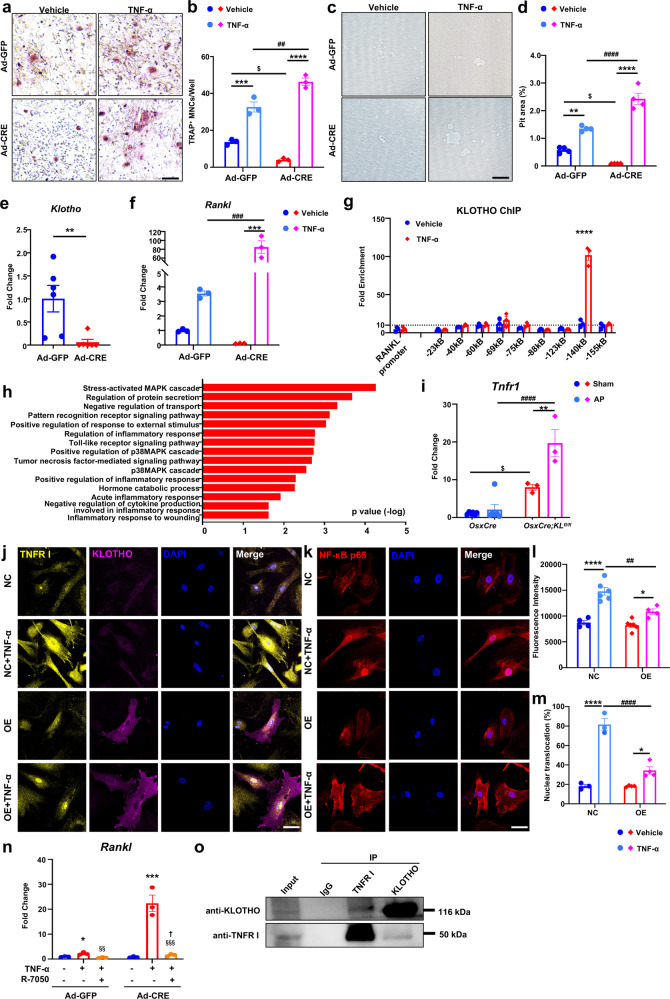
Osteoblast-Klotho mediates osteoclast formation and suppresses TNF-α-induced TNF receptor I activation. a–d Primary osteoblasts from KLfl/fl mice were transfected with adenovirus-mediated Cre (Ad-CRE), Ad-GFP were used as control. Transfected osteoblasts and bone-marrow-derived macrophage (BMMs) co-cultured under TNF-α or vehicle treatment. a, b TRAP staining and quantitative analyses after 9d induction. n = 3. c, d Pit resorption assay after 13d induction. n = 4. e Gene expression of Klotho in osteoblasts from KLfl/fl mice after adenovirus transfection. n = 6. f Transcription of osteoclastogenesis related gene Rankl. n = 3. g Klotho-overexpressed MC3T3 cells were treated with TNF-α (10 ng/mL, 60 min) or vehicle followed by ChIP for Klotho. DNA was quantified by qPCR and results were exhibited as fold enrichment versus control IgG. n = 3. h GO enrichment analysis of upregulated genes in DEGs. n = 3. i Gene expression of Tnfr1 in AP model of OsxCre;KLfl/fl and control mice. n = 6 in OsxCre-sham and OsxCre-AP groups and n = 3 in OsxCre;KLfl/fl-sham and OsxCre;KLfl/fl AP groups. j Immunocytochemistry of Klotho and TNFR I in Klotho-overexpressed progenitors. k Immunocytochemistry shows NF-κB p65 distribution in cytoplasm and nucleus. l Quantification of TNFR I expression during TNF-α stimulation. n = 4 in NC-CTRL and OE (Klotho Overexpression)-TNF-α groups; n = 6 in NC-TNF-α and OE-CTRL groups. m Quantification of NF-κB p65 nuclear translocalization. n = 3 in NC-Vehicel and NC-TNF-α groups; n = 4 in OE-Vehicle and OE-TNF-α groups. n Gene expression of Rankl in primary osteoblasts and Klotho-deleted osteoblasts when treated with TNF-α in combination with R-7050 (TNFR I inhibitor). n = 3. o Coimmunoprecipitation assay was performed on Klotho-overexpressed MC3T3 cells. Proteins were collected and immunoprecipitated with Klotho or TNFR I antibodies. Western blot was performed using Klotho or TNFR I antibodies to determine the interaction between Klotho and TNFR I. IP immunoprecipitation. *, $, †p < 0.05, **, ##, §§p < 0.01, ***,$$$, §§§p < 0.001, ****, ####p < 0.0001, * indicates AP versus sham, or Vehicle versus TNF-α. $ indicates OsxCre Sham versus OsxCre;KLfl/fl Sham, or NC Vehicle versus OE Vehicle. # indicates Ad-GFP Vehicle versus Ad-CRE Vehicle, OsxCre AP versus OsxCre;KLfl/fl AP, or NC-TNF-α versus OE-TNF-α. § indicates TNF-α versus TNF-α + R-7050. † indicate Ad-GFP TNF-α + R-7050 versus Ad-CRE TNF-α + R-7050. All data are shown as the mean ± SEM. Scale bar, 100 μm (a, c), and 50 μm (j, k)

