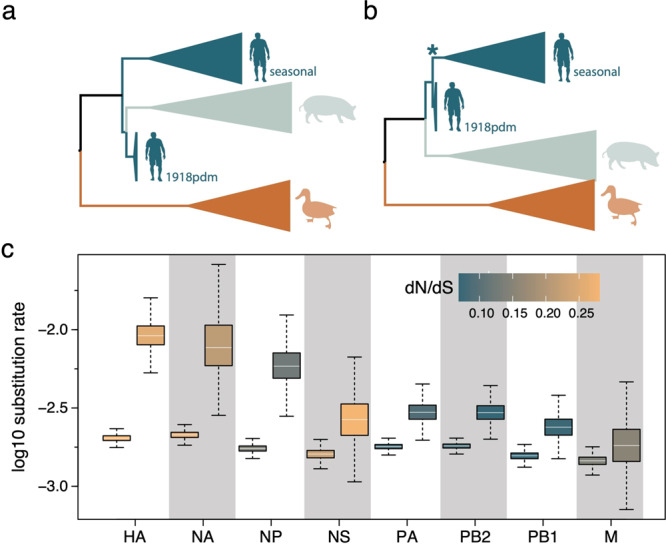
Fig. 4. Time-measured phylogenetic patterns and evolutionary rates estimated using Bayesian molecular clock modeling.

a The phylogenetic pattern for HA and NA inferred using a standard host-specific local clock (HSLC) model. b A monophyletic cluster for human pandemic and seasonal viruses estimated for HA and NA using an extended HSLC model (and using either model for all other segments). The star denotes the branch that is allowed to have a separate evolutionary rate in the HSLCext model. c Evolutionary rate estimates for the human lineage (first box) and the seasonal ancestral branch (second box) under the extended HSLC model for each segment ordered according to difference in these two rates. The boxes are colored according to the dN/dS estimate for the human lineage and the seasonal ancestral branch in each segment. The horizontal line in the whisker plots represents the mean. The lower and upper bounds of the boxes indicate the first and third quartile, respectively. Vertical lines are the upper and lower whisker representing the minimum of the largest value and 1.5 times the inter quartile distance, respectively the maximum of the smallest value and 1.5 times the inter quartile distance. Sample size from the MCMC chain is 2702 for NA and 4502 for all other segments. Source data are provided as a Source Data file.
