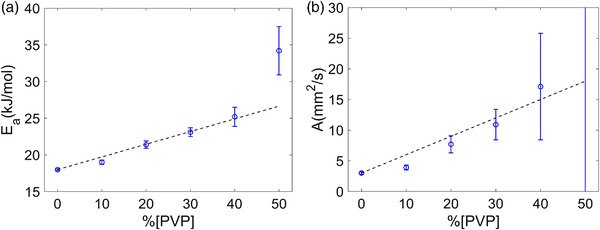
FIGURE 2.

Arrhenius model fit parameter values and error bars are shown as a function of %PVP for activation energy, E a, in (a) and for collision frequency factor, A, in (b). At 50%, A was 350 ±470 mm2/s (outside of the plot). Dashed lines in both plots show the linear fits based on PVP 10%–40% points with intercept fixed to appropriate water values 3 mm2/s (for A) and 18 kJ/mol (for E a) and fit slopes of K E = 0.173 ± 0.007 (kJ/(mol%)) and K A = 0.30 ± 0.03 (mm2/(s%))
