
FIGURE 1.
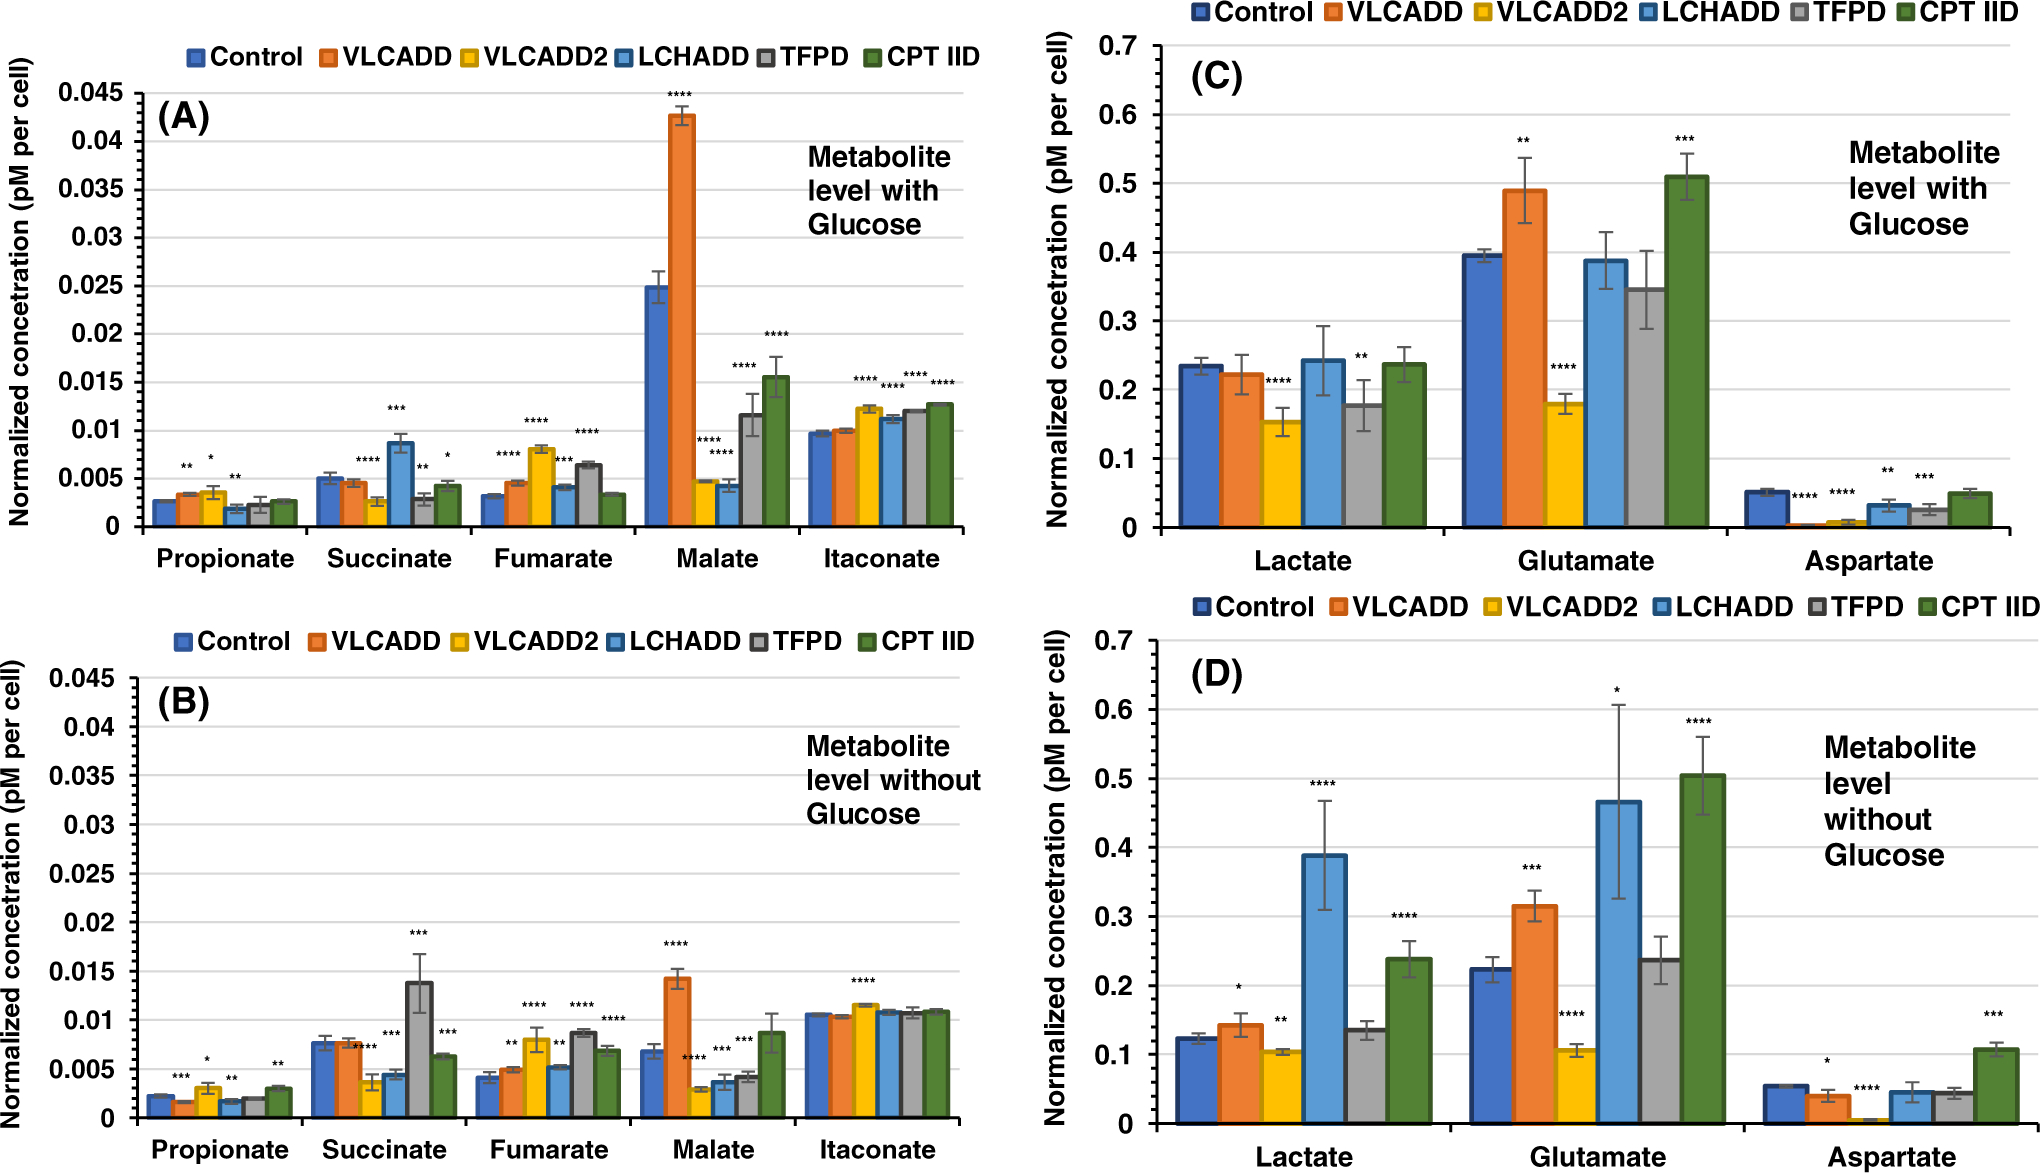
Measurements of selected TCA cycle intermediates in control and cells deficient in various β-oxidation proteins. Cells were counted and resuspended in processing extract buffer and MS assay performed with the final concentration expressed in μM, which was divided by the number of cells in the pellet and multiplied by 106. All media had no additional glutamine or pyruvate, and lipid stripped FBS was included instead of regular FBS in all. (A) All media included glucose and (B) all media was devoid of glucose. Data are presented as mean ± SD (SD) for replicates and analyzed using unpaired Student’s t test (using GraphPad Prism 7.04 software). *P < .05, **P < .01, ***P < .001, ****P < .0001, compared with control cells