

Abstract
Dormant, disseminated tumor cells (DTCs) can persist for decades in secondary tissues before being reactivated to form tumors. The properties of the premetastatic niche can influence DTC phenotype. To better understand how matrix properties of premetastatic niches influence DTC behavior, we implemented three hydrogel formulations to model a permissive niche and two, non-permissive niches. Poly(ethylene glycol) (PEG)-based hydrogels with varying adhesivity ([RGDS]) and degradability ([N-vinyl pyrrolidinone]) were implemented to mimic a permissive niche with high adhesivity and degradability and two non-permissive niches, one with moderate adhesivity and degradability and one with no adhesivity and high degradability. The influence of matrix properties on estrogen receptor positive (ER+) breast cancer cells (MCF7s) was determined via a multimetric analysis. MCF7s cultured in the permissive niche adopted a growth state, while those in the non-permissive niche with reduced adhesivity and degradability underwent tumor mass dormancy. Complete removal of adhesivity while maintaining high degradability induced single cell dormancy. We also demonstrate the ability to mimic reactivation of dormant cells through a dynamic increased in [RGDS]. This platform provides the capability of inducing growth, dormancy, and reactivation of ER+ breast cancer and could be useful in understanding how premetastatic niche properties influence cancer cell fate.
Keywords: tissue engineering, cancer metastasis, extracellular matrix, disseminated tumor cells, cancer
Graphical Abstract

An in vitro platform that induces dormancy and reactivation is a useful tool in drug development to eliminate dormant cancer and prevent metastatic relapse. In this study, we implement three hydrogel formulations that mimic a permissive and two non-permissive niches by tuning ligand (RGDS) density and degradability to induce growth, distinct forms of dormancy, and reactivation in ER+, MCF7s.
1. Introduction
Despite significant improvements in cancer prevention, detection, and treatment, metastasis remains an ongoing problem with a dismal 22–28% 5-year survival rate for metastatic breast cancer patients.[1,2] During metastasis, disseminated tumor cells (DTCs) originating from a primary tumor infiltrate the cardiovascular system and extravasate into secondary organs. In many cases, there is a latency period between initial diagnosis and treatment of the primary tumor and the onset of metastatic cancer that can range from a few months to several decades depending on the origin and receptor status of the primary tumor.[2,3] This latency period is explained at a cellular level by DTCs that can enter a dormant state post infiltration of secondary tissues.[4,5] During dormancy, DTCs may enter cellular dormancy, characterized by solitary cells that survive in cell-cycle arrest via anti-apoptotic mechanisms, or tumor mass dormancy, characterized by clustered cells residing in a balanced state of proliferation and apoptosis.[4,6,7] Metastatic relapse can occur when dormant cells undergo a phenotypic switch to resume proliferation and invasive growth.[8] A potentially positive aspect concerning DTC dormancy is that it provides a potential therapeutic “window of opportunity” lasting up to decades in which eliminating dormant DTCs or preventing their reactivation could be used to prevent metastatic recurrence. However, current chemotherapeutics that target proliferating cancer cells, fail to effectively eliminate quiescent, dormant DTCs.[9,10] Towards this effort, in vitro platforms that induce dormancy and reactivation are necessary to investigate cancer dormancy at a resolution that provides mechanistic understanding at the cellular level to develop new therapeutic approaches with potentially higher efficacy in treating dormant DTCs.
A general understanding of the factors that can induce dormancy in vivo has led to the development of in vitro models.[5] In particular, interactions between tumor cells and secondary organs can establish a favorable premetastatic niche that supports metastatic seeding.[11] For instance, a favorable premetastatic niche that provides nutrients, permissive extracellular matrix (ECM), and pro-tumor immune cells can promote growth and tumor formation. Conversely, restricting these factors in a non-permissive premetastatic niche can induce dormancy. Thus, factors found in unfavorable premetastatic niches including immune responses, stromal cell signaling, and nutrient deprivation have all been applied to induce dormancy in vitro.[5]
A key component of the premetastatic niche responsible for inducing DTC dormancy is the microenvironmental cues provided by the ECM of secondary organs. In a favorable premetastatic niche, a permissive ECM contains key proteins and that provide mechanical and biochemical support to promote cell-matrix adhesions and matrix remodeling that promote growth.[11] When cancer cells fail to establish integrin-mediated adhesions to ECM proteins in unfavorable non-permissive niches, downstream signaling may lead to dormancy.[12] Using this logic, we previously implemented three poly(ethylene glycol) (PEG)-based hydrogels to induce growth and distinct dormant states in triple negative breast cancer cells, MDA-MB-231s, and it’s associated organotropic sublines (BoM-1833, LM2–4175, and BrM2a-831).[13–16] We incorporated a PEG-based hydrogel containing a proteolytically degradable peptide (PQ), cell adhesive peptide (RGDS), and non-degradable comonomer N-vinyl pyrrolidinone (NVP). RGDS and NVP concentrations were varied to mimic three distinct pre-metastatic ECMs that cells might experience during early stages of secondary organ infiltration: (1) a permissive niche with high (++) adhesivity and high (++) degradability composed of 2.1 mM RGDS and 0 mM NVP, (2) a non-permissive niche (non-permissive niche-1) with moderate (+) adhesivity and low (+) degradability composed of 0.9 mM RGDS and 9.4 mM NVP, and (3) a second non-permissive niche (non-permissive niche-2) with no (−) adhesivity and (++) high degradability composed of 0 mM RGDS and 0 mM NVP. The permissive niche mimicked a premetastatic niche that supports both matrix-adhesion and degradability and led to the formation of large, proliferating clusters in the 231 lines. Non-permissive niche-1 mimicked a premetastatic niche in which cells could adhere to their matrix but do not express the appropriate proteases to degrade their surround ECM. This niche led to balanced dormancy in the 231 lines, with a delicate balance between proliferation and death. Non-permissive niche-2 mimicked a niche in which cells could degrade their matrix but are unable to form focal adhesions. This niche led to restricted survival dormancy in the parental 231 line and balanced cellular dormancy in organotropic sublines.
While these studies demonstrated how tuning ECM adhesivity and degradability in the premetastatic niche can influence cancer cell fate of triple negative breast cancer, clinical data indicates that estrogen receptor (ER+) breast cancer has a higher probability of undergoing dormancy for a longer time period.[17] Dormancy in ER+ DTCs often persists longer than 5 years and in some cases longer than 20 years, compared to ~2 years in ER- breast cancers, providing a longer window of time to potentially treat these patients.[18] Thus, with a greater chance of entering dormancy and a longer period of latency, the ability to effectively treat dormant DTCs originating from ER+ breast cancers offers the potential for a significant clinical impact if achieved.
To investigate if tuning matrix properties via ECM modulation can induce dormancy in the ER+ breast cancer cell line, MCF7, we implemented the same formulations that mimicked a permissive and two distinct non-permissive premetastatic niches. To assess phenotype, we measured dormancy-associated metrics including viability, proliferation, metabolic activity, chemoresistance, and the p-ERK:p-38 ratio. Our results indicate that matrix adhesivity and degradability in the permissive niche promoted a proliferative growth state, while decreased degradability (non-permissive niche-1) induced a balanced dormancy state, and no adhesivity (non-permissive niche-2) led to restricted survival, cellular dormancy. We also demonstrate the ability to recapitulate metastatic relapse via reactivation of dormant cells in non-permissive niche-2 via dynamic, on-demand incorporation of RGDS. Together, this data provides valuable insight into how the matrix properties of the premetastatic niche can influence dormancy and subsequent reactivation in clinically relevant, ER+ breast cancer and provides a platform for future studies that aim to better understand the mechanisms of these influences and for development of new therapeutic approaches to treat dormant cancer.
2. Results
2.1. Hydrogel Characterization
It is well established that cell-ECM interactions play a key role in governing cancer cell fate.[5,19–29] In this context, we previously developed sixteen unique hydrogel formulations composed of three components: (1) proteolytically degradable PEG (PEG-PQ), (2) integrin ligating PEG-RGDS, and (3) a non-degradable crosslinker NVP. By systematically tuning the concentration of PEG-RGDS and NVP, hydrogel adhesivity and degradability were varied, inducing different phenotypes in the parental triple negative breast cancer line (MDA-MB-231) and three of its organotropic sublines (BRM2a-831s, LM2–4175s, BoM-1833s).[13–15] Control over a cell’s ability to interact with the hydrogel via formation of integrin-mediated adhesions is governed by PEG-RGDS concentration. NVP incorporation increases the number of non-degradable crosslinks resulting in decreased degradability and increased cell confinement. Here, we implemented three hydrogel formulations to mimic three premetastatic niches: a permissive niche (2.1 mM PEG-RGDS, 0 mM NVP) and two non-permissive niches (non-permissive niche-1: 0.9 mM PEG-RGDS, 9.4 mM NVP) and (non-permissive niche-2: 0 mM PEG-RGDS, 0 mM NVP).[9,16] It is important to note that many factors can influence how permissive a microenvironment is including soluble factors such as nutrients and oxygen, secondary cell types, vasculature, etc. In this study, “permissive” and “non-permissive” terms refer specifically to induction of a growth or dormant state respectively via tuning of ECM adhesivity and degradability. The permissive niche has high levels of degradability and adhesivity that promote cell-matrix interactions and growth. Non-permissive niche-1 has decreased degradability and adhesivity, mimicking conditions where DTCs are unable to locally degrade the surrounding matrix. Non-permissive niche-2 lacks adhesivity, mimicking a condition in which DTCs fail to form integrin-mediated adhesions in their new environment.
To measure how the addition of NVP altered matrix mechanical properties, we quantified hydrogel elasticity. In acellular hydrogels, hydrogels without NVP had an elastic modulus of 6.5 ± 0.3 kPa, while hydrogels containing 9.4 mM NVP had an elastic modulus of 11.6 ± 0.5 kPa (Figure 1B). As expected, increasing the number of crosslinks via NVP incorporation increased hydrogel elasticity. In the presence of cells, the elastic modulus decreased to 4.6 ± 0.4 and 10.1 ± 0.5 kPa in hydrogels with 0 mM NVP and 9.4 mM NVP at day 0 (6 hr post encapsulation), respectively (Figure 1). After culturing cell-laden hydrogels for 15 days, the elastic modulus further decreased to 4.2 ± 0.6 kPa (0 NVP) and 7.6 ± 0.8 kPa (9.4 mM NVP), likely due to cell-mediated hydrogel degradation through the release of MMPs 2 and 9 (Figure 1B). The elastic modulus values are similar to those previously reported in PEG-PQ hydrogels.[14,16,30–32]
Figure 1: Hydrogel Characterization.

(A) Schematic of three hydrogel formulations that mimic a permissive (5% PEG-PQ, 2.1 mM PEG-RGDS, 0 mM NVP) and non-permissive microenvironments (Non-permissive-1: 5% PEG-PQ, 0.9 mM PEG-RGDS, 9.4 mM NVP and Nonpermissive-2: 5% PEG-PQ, 0 mM PEG-RGDS, 0 mM NVP). Quantification of the (B) elastic modulus of acellular and cell-laden hydrogels at day 0 (D0: 12hr post encapsulation) and day 15 (D15), (C) degradation upon exposure to collagenase at 100 µg/mL, (D) hydrogel degradation rate measured from the linear region of the trends in (C), and (E) measured concentration of RGDS in the hydrogels. Overall, NVP incorporation increased compressive modulus, and decreased degradation and RGDS incorporation. * indicates p<0.05 obtained from a one-way ANOVA. n=5 hydrogels per condition. Values represent mean + standard deviation.
Hydrogel degradability was altered via NVP incorporation. In the presence of 100 µg/mL collagenase IV, hydrogels without NVP degraded at a rate of 0.0125 ± 0.0006 min−1 and achieved 100% degradation in 80 min (Figure 1D), while hydrogels with NVP had a significantly lower degradation rate of 0.0081 ± 0.0016 min−1 and achieved ~80% degradation in 120 min (Figure 1D). We also quantified RGDS incorporation into hydrogels photopolymerized with 10 mM PEG-RGDS and 0 mM NVP or 1mM PEG-RGDS and 9.4 mM NVP in the pre-polymer solution. Hydrogels without NVP had a conjugation efficiency of 20.7 ± 6.6%, resulting in a final concentration of 2.1 ± 0.7 mM of incorporated PEG-RGDS (Figure 1C). With NVP, incorporation efficiency increased to 90.4 ± 0.9% with a final concentration of 0.9 ± 0.1 mM of incorporated PEG-RGDS (Figure 1C). Increased PEG-RGDS incorporation in the presence of NVP is likely due to the increased number of available acrylate groups during photopolymerization as previously described.[13–16]
To determine the impact of varying hydrogel elasticity, degradation, and PEG-RGDS concentration on ER+ breast cancer, we encapsulated the ER+ cell line, MCF7, in hydrogel formulations that mimicked either a permissive or non-permissive niche. Hydrogel-induced phenotypes were quantified using dormancy-associated metrics[16] including temporal changes in cell viability, early apoptosis, proliferation, and metabolism as well as cell morphology, chemoresistance, and p38 and pERK expression. A multimetric analysis previously used to classify the phenotypic state of triple negative breast cancer cells was implemented to classify the resulting phenotypes as (1) growth, (2) balanced tumor mass dormancy, or (3) restricted survival, cellular dormancy.
2.2. Cell Viability
MCF7s were encapsulated in a permissive niche containing 2.1 mM PEG-RGDS (++ adhesivity) and 0 mM NVP (++ degradability), non-permissive niche-1 containing 0.9 mM PEG-RGDS (+ adhesivity) and 9.4 mM NVP (+ degradability), and non-permissive niche-2 containing 0 mM PEG-RGDS (- adhesivity) and 0 mM NVP (++ degradability) that induced growth, cellular dormancy, and restricted survival dormancy in triple negative MDA-MB-231s respectively.[14,16] To investigate the influence of hydrogel properties on ER+ breast cancer, MCF7s were cultured in each formulation for 15 days. We anticipate that culture beyond 15 days would not induce any significant changes to cell phenotype based on our previous studies.[14] Viability was measured at day 0 (6 hr post encapsulation) and day 15 (Figure 2). At day 0, viability was >81.9% (permissive niche: 81.9 ± 3.5%, non-permissive-1 niche: 83.6 ± 2.0%, non-permissive niche-2: 85.0 ± 2.0%) in all hydrogel formulations, indicating overall low cytotoxicity during encapsulation and photopolymerization. At day 15, viability remained high in the permissive (82.9 ± 1.5%) and non-permissive niche-1 (80.3 ± 3.0%), however, viability significantly decreased to 42.5 ± 2.5% in non-permissive niche-2 (Figure 2B).
Figure 2: Cell Viability.

(A) Representative maximum intensity z-projections of 3D image stacks of MCF7s on day 0 (6 hr post encapsulation) or day 15 in each hydrogel formulation. Live cells were fluorescently labeled with calcein AM (green) and dead cells with ethidium homodimer (red). Scale bar = 100 μm. Quantification of cell viability on (A) day 0 (6 hr post encapsulation) or (C) day 15, and (D) viable cell ratio (number of viable cells at day 15 normalized to the number of viable cells at day 0). Results indicate significantly lower viability and number of viable cells at day 15 in non-permissive niche-2. Dashed line represents a ratio of 1 (no change in the number of viable cells). (B,C) * indicates statistically significant difference (p<0.05) determined via a one-way ANOVA. (D) # indicates statistically significant difference (p<0.05) from the value 1 obtained from a 2-sample T-test. All following figures use this same nomenclature. n=6 z-stacks from 6 individual hydrogels. Values represent mean + standard deviation.
To measure temporal changes in the viable cell density, the viable cell ratio (number of viable cells present at day 15 normalized to the number of viable cells present at day 0) was quantified. In the permissive niche, the number of viable MCF7s increased by 1.24 ± 0.13-fold (Figure 2C). Decreased degradability in non-permissive niche-1 had no significant influence on the number of viable cells and the viable cell ratio did not significantly change over the 15 days in culture with a measured value of 1.05 ± 0.01. Non-permissive niche-2 induced a significant decrease in the number of viable cells present at day 15 (viable cell ratio: 0.33 ± 0.02) (Figure 2C).
These results indicate that increased adhesivity and degradability in the permissive niche promoted viability while also increasing the density of viable MCF7s over 15 days in culture. Reducing adhesivity and degradability, via NVP incorporation, in non-permissive niche-1 supported MCF7 viability but did not promote a significant increase in the viable cell density. Removing all adhesivity in non-permissive niche-2 significantly restricted cell survival, indicating the role of integrin-mediated adhesion in MCF7 survival.
2.3. Early Apoptosis
To determine the mode of death, cells undergoing apoptosis at day 15 were labeled with the early apoptosis marker, Annexin V, and the percentage of the cell population expressing Annexin V was quantified (Figure 3). Apoptosis was low in the permissive niche (2.7 ± 1.4%), while non-permissive niche-1 (16.5 ± 2.3%) and non-permissive niche-2 (43.0 ± 4.2%) displayed an increased percentage of the cell population expressing Annexin V. Consistent with viability values, MCF7s in non-permissive niche-2 displayed greater apoptosis (43.0 ± 4.2%) (Figure 3 B). We previously demonstrated that the percentage of Annexin V+ (apoptotic) cells correlated with the percentage of ethidium homodimer+ (dead) cells in the triple negative breast cancer lines via a Pearson Correlation test.[16] Here we observed the same trend, indicating that apoptosis was the primary mode of death for MCF7s in this platform (Supplemental Figure 1).[9]
Figure 3: Early Apoptosis.

(A) Representative maximum intensity z-projections from 3D image stacks of MCF7s on day 15 in each hydrogel formulation. Cells were fluorescently immunolabeled for expression of the early apoptosis marker Annexin V (red: apoptotic cells) and counterstained with Hoechst (blue: nuclei). Scale Bar = 100 μm. (B) Quantification of the percentage of the cell population Annexin V+ on day 15. Results indicate higher apoptosis at day 15 in non-permissive niche-1 and −2. * indicates p<0.05. n=6 z-stacks from 6 individual hydrogels. Values represent mean + standard deviation.
2.4. Proliferation
Quantifying cell proliferation can provide insight into whether cells are actively replicating or quiescent. Thus, proliferating cells were labeled via EdU incorporation into newly synthesized DNA in dividing cells. The percentage of proliferating (EdU+) cells was quantified in each hydrogel formulation at day 0 (6 hr post encapsulation) and day 15. At day 0, proliferation values were 16.6 ± 4.2% in the permissive niche, 17.1 ± 3.8% in non-permissive niche-1, and 14.8 ± 2.0% in non-permissive niche-2 (Figure 4). At day 15, proliferation significantly increased to 43.0 ± 5.3% in the permissive niche. No significant change in proliferation was observed in non-permissive niche-1 or −2 compared to day 0 (non-permissive niche-1: 18.1 ± 3.5%, non-permissive niche-2: 12.8 ± 4.3%) (Figure 4A,B).
Figure 4: Proliferation.

(A) Representative maximum intensity z-projections from 3D image stacks of MCF7s on day 0 (6 hr post encapsulation) or day 15 in each hydrogel formulation. Proliferating cells were fluorescently labeled with EdU (red) and counterstained with Hoechst (blue: nuclei). Scale bar = 100 μm. Quantification of the percentage of the cell population labeled EdU+ on (B) day 0 (6 hr post encapsulation) or (C) day 15, and the (D) proliferation ratio (number of EdU+ cells on day 15 normalized to day 0). Dashed line represents a ratio of 1 (no change in the number of proliferating cells). (B,C) Results indicate the permissive niche promotes proliferation, while cells in non-permissive niche-1 and −2 exhibited no change in the number of proliferating cells. * indicates statistically significant difference (p<0.05). (D) # indicates statistically significant difference (p<0.05) from the value 1. n=6 z-stacks from 6 individual hydrogels. Values represent mean + standard deviation.
To quantify temporal changes in proliferation, the EdU+ cell ratio (number of proliferating cells at day 15 normalized to the number of proliferating cells at day 0) was quantified. The number of EdU+ cells present at day 15 significantly increased by 3.48 ± 0.54-fold in the permissive niche (Figure 4C). Consistent with viability results, the number of EdU+ cells did not significantly change throughout the 15 day culture period in non-permissive niche-1 (EdU+ cell ratio: 1.07 ± 0.17) or −2 (EdU+ cell ratio: 0.81 ± 0.26) (Figure 4C).
Increased proliferation was observed in the permissive niche was likely due to a high concentration of RGDS and high degradability. The results indicate that decreased degradability in non-permissive niche-1 or reduced adhesivity in non-permissive niche-2 did not promote significant changes in the percentage or number of EdU+ MCF7s at day 15. Consistent with viability results, this data demonstrates that the permissive niche promotes cell survival and proliferation, non-permissive niche-1 maintains cell viability but does not promote increased proliferation, and non-permissive niche-2 restricts survival but does not promote increased proliferation.
2.5. Ratiometric Analysis of Cell Viability, Death, & Metabolic activity
To quantify whether the niches induced a balanced survival state, the new live to new dead cell ratio was measured. This ratio includes the number of new live cells (number of live cells present at day 15 minus the number of live cells present at day 0) divided by the number of new dead cells (number of dead cells present at day 15 minus the number of dead cells present at day 0). In the permissive niche, there were 7.84 ± 4.17-fold more new live cells than new dead cells at day 15 (Figure 5). MCF7s in non-permissive niche-1 did not display a significant difference between new live and new dead cells, indicating a balance in proliferation and death. In non-permissive niche-2, there were no new live cells at day 15, consistent with the viability measurements discussed in Section 2.2.
Figure 5: Ratiometric Analysis of Viability, Early Apoptosis, & Metabolic Activity.

(A) The number of new live cells divided by the number of new dead cells formed in the hydrogel over 15 days in culture. Dashed line represents a ratio of 1 (indicating a balance between the number of new live and dead cells formed post day 0). (B) Number of EdU+ cells divided by the number of Annexin V+ cells at day 15. Dashed line represents a ratio of 1 (indicating a balance between proliferation and apoptosis). (C) Quantification of relative metabolic activity using an Alamar blue assay on day 15 normalized to metabolic activity at day 0. Results indicate that the permissive niche promoted cell survival, proliferation, and increased metabolic activity, non-permissive niche-1 induced a near perfect balance in proliferation and apoptosis resulting in a constant cell density and metabolic activity over 15 days, and non-permissive niche-2 induced increased apoptosis leading to a decreased viable cell density and no change in metabolic activity over 15 days. Dashed line represents a ratio of 1 (no change in metabolic activity post day 0). # indicates statistically significant difference (p<0.05) from the value 1. n=6 z-stacks from 6 individual hydrogels. Values represent mean + standard deviation.
To determine if MCF7s displayed a balance between proliferation and apoptosis, the number of EdU+ cells at day 15 compared to the number of Annexin V+ cells at day 15 (EdU+: Annexin V+ cell ratio) was quantified. In the permissive niche, there were significantly more (15.29 ± 2.39) proliferating cells than early apoptotic cells (Figure 5B). Non-permissive niche-2 had significantly more apoptotic than proliferating cells (EdU+: Annexin V+ cell ratio: 0.32 ± 0.10) (Figure 5 B). Cells in non-permissive niche-1 showed no significant difference between the number of proliferating and apoptotic cells (EdU+: Annexin V+ cell ratio: 1.09 ± 0.18), indicating a near perfect balance in proliferation and apoptosis (Figure 5 B).
Metabolic activity was also measured as dormant populations often display decreased metabolic activity.[4,33] An Alamar Blue assay was used to measure metabolic activity at day 15 and day 0. The metabolic ratio was quantified as the activity measured at day 15 normalized to day 0 values. Metabolic activity significantly increased in the permissive niche (metabolic ratio: 5.13 ± 1.9), while no significant changes were observed in non-permissive niche-1 (metabolic ratio: 0.99 ± 0.13) (Figure 5C). Interestingly, since only 43% of cells remained viable at day 15 in non-permissive niche-2, we anticipated to a metabolic ratio close to 0.43, however results indicated a metabolic ratio of 0.92 ± 0.17, potentially due to alterations in metabolic intake of surviving cells.[34,35] Consistent with other phenotypic results, this data indicates that the permissive niche increased metabolic activity, likely due to the increase in viable and proliferating cells discussed in Sections 2.2 and 2.4, while the two non-permissive niches showed no significant change in metabolic activity after 15 days in culture, an indicator of a dormant state.
2.6. Solitary Cell & Cell Cluster Morphology
Cell and cluster morphology can aid in classifying cancer cell phenotypes. Dormant cells are often characterized as solitary, rounded single cells, or as small, round cell clusters.[4,7,14] To assess how hydrogel properties influenced MCF7 morphology, cells were fixed, fluorescently labeled for F-actin, and counterstained with Hoechst to label the nuclei (Figure 6). Cells and cell clusters were manually traced using FIJI software. We quantified the percentage of the cell population residing as solitary individuals or in clusters (>2 nuclei). The percentage of the cell population residing as solitary cells compared to clusters at day 15 was quantified as the single cell:clustered cell ratio. In the permissive niche and non-permissive niche-1, there were significantly more MCF7s residing in clusters (single cell:clustered cell ratio: 0.16 ± 0.04 (permissive niche), 0.13 ± 0.03 (non-permissive niche-1)), while most cells in non-permissive niche-2 resided as solitary cells (single cell:clustered cell ratio: 2.54 ± 1.20) (Figure 6 A). We also measured if cells and clusters appeared as round or spread, where round cells/clusters were characterized as having a roundness value ≥ 0.8.[13–16] In all hydrogel formulations, there were significantly more round cells (>99.1%) and round clusters (>97.0%) compared to spread cells or clusters (Figure 6C,D). While MCF7s formed clusters in all formulations, cluster size differed significantly in the permissive niche. Cell clusters formed in the permissive niche were significantly larger (50.4 ± 16.6 µm diameter) than those formed in non-permissive niche-1 (37.2 ± 9 µm) or −2 (31.2 ± 6.4 µm) (Figure 6E). Accounting for the differences in cluster size, there were ~1.47 times as many clusters in non-permissive niche-1 compared to the permissive niche, quantified by cluster cell density (Figure 6 F). Cluster density was the lowest in non-permissive niche-2 since most cells in this hydrogel remained as single cells rather than forming clusters. Accordingly, non-permissive niche-2 had the greatest single cell density (Figure 6G). Overall, these results demonstrate that MCF7s cultured in the permissive niche formed larger, round clusters while those in non-permissive niche-1 formed smaller, round clusters, and those cultured in non-permissive niche-2 mostly appeared as solitary, round cells.
Figure 6: Morphological Analysis of Solitary Cells & Cell Clusters.

(A) Representative maximum intensity z-projections from 3D image stacks of MCF7s after 15 days in culture in each hydrogel formulation. Cells were fluorescently labeled with phalloidin (red: F-actin) and counterstained with Hoechst (blue: nuclei). Scale bar = 100 μm. Quantification of the (B) number of cells residing as individual, solitary cells divided by the number of cells residing in cell clusters, (C) percentage of cells residing as round solitary cells, (D) percentage of clusters presenting as round, (E) cluster diameter, (F) cluster density, and (G) solitary cell density. Results indicate that the permissive and non-permissive niche-1 promote the formation of clusters, while cells in non-permissive niche-2 remain as solitary single cells. * indicates statistically significant difference (p<0.05). n=6 z-stacks from 6 individual hydrogels. Values represent mean + standard deviation.
2.7. Chemosensitivity to Doxorubicin
Chemoresistance has become a well-established, dormancy-related metric, as chemotherapeutics that target proliferating cells often fail to target and eliminate dormant cells.[10] While not all chemoresistant cells are dormant, this metric, along with other supporting metrics discussed in the previous sections, can assist in classifying a dormant phenotype. To quantify if MCF7s in the three niches displayed increased chemoresistance, varying concentrations of DOX (0.001–2 mM) was added to cell-laden hydrogels at day 15. DOX was chosen as it is a well-studied chemotherapy commonly used in the clinic, mostly in combination with several other compounds.[36–38] Furthermore, previous drug studies that tested the cell responses to paclitaxel, 5-fluouracil, and DOX using our hydrogel platform showed that DOX had the greatest efficacy. DOX is also autofluorescent which affords the capability to easily quantify transport into and within cells using fluorescent microscopy. The cells were cultured with DOX exposure for 48 hr and the live cells were labeled with calcein AM as previously described (Figure 7).[9,16] Cell viability was quantified as the number of viable cells at each concentration divided by the number of viable cells present in the vehicle only control (media containing 2% DMSO).[39]
Figure 7: Doxorubicin Chemosensitivity.

(A) Representative maximum intensity z-projections from 3D image stacks of live (green: calcein AM) MCF7s after 15 days in culture in each hydrogel formulation followed by 48 hr exposure to doxorubicin at the indicated concentration. Quantification of (B) cell viability, (C) dose-response curves, (D) EC50 and (E) IC50 values. MCF7s in non-permissive niche-1 and −2 displayed significantly higher chemoresistance than cells in the permissive niche. * indicates statistically significant difference (p<0.05). n=6 z-stacks from 6 individual hydrogels. Values represent mean + standard deviation.
Compared to the permissive niche, MCF7s in non-permissive niche-1 had significantly more viable cells at multiple doses including 0.001–0.1 and 1 mM, while MCF7s in non-permissive niche-2 had significantly higher viability across all dose concentrations (Figure 7B). Additionally, cells in non-permissive niche-1 displayed significantly higher viability than non-permissive niche-2 for multiple doses. For instance, at 0.001 mM, viability was 74.4 ± 1.4% in the permissive niche, 79.5 ± 2.5% in non-permissive niche-1, and 92.2 ± 3.9% in non-permissive niche-2 (Figure 7B). Similarly, at 0.01 mM, viability decreased to 37.5 ± 3.1% in the permissive niche, while non-permissive niche-1 remained 49.7 ± 3.4% viable, and 68.2 ± 2.3% viable in non-permissive niche-2 (Figure 7B). Similar trends were observed for the other DOX concentrations tested. Viability data was fit to obtain dose-response curves to calculate EC50 and IC50 values (Figure 7C-E). MCF7s in the permissive niche had an EC50 of 5.3 ± 0.5 µM and an IC50 5.2 ± 0.4 µM (Figure 7C-E). Cells in non-permissive niche-1 and −2 displayed significantly higher EC50 and IC50 values (non-permissive niche-1: EC50: 13.5 ± 3.1 µM and IC50: 11.0 ± 1.4 µM; non-permissive niche-2: EC50: 52.7 ± 5.2 µM and IC50: 49.8 ± 3.9 µM) (Figure 7 C-E). These results indicate that MCF7s in non-permissive niche-1 and −2 displayed increased chemoresistance to DOX compared to cells cultured in the permissive niche.
2.8. Phosphorylated ERK (pERK) & p38 (p-p38) Expression
The ratio between p-ERK and p-38 has become a well-established dormancy marker.[40–42] ERK activity is known to promote proliferation. When residing in an unfavorable niche, ERK expression decreases and is often accompanied by an increase in p38 expression, an inhibitory regulator that promotes cell cycle arrest. The p-ERK:p-38 ratio has been established as a predictor of a shift in tumorigenicity to dormancy in vivo.[40,41] To measure p-ERK and p-p38 expression, cell-laden hydrogels were fixed at day 15, fluorescently labeled for phosphorylated ERK1/2 and p38, and counterstained with Hoechst (Figure 8). After imaging, expression was quantified by measuring the mean fluorescent intensity. MCF7s in the permissive niche had ~5 times higher p-ERK expression compared to non-permissive niche-1 and −2 (Figure 8B). In non-permissive niche-1 and −2, there was twice as much p38 expression compared to the permissive niche (Figure 8C). To quantify the ratio between p-ERK and p-p38 expression, p-ERK intensity was divided by p-38 intensity. The permissive niche had the highers p-ERK:p38 ratio (5.9 ± 1.1) compared to non-permissive niche-1 (0.5 ± 0.2) and non-permissive niche-2 (0.5 ± 0.1) (Figure 8D). These results demonstrate that it is likely that MCF7s in non-permissive niche-1 and −2 transitioned into a dormant state.
Figure 8: Phosphorylated p38 (p-p38) & ERK (p-ERK) Expression.

(A) Representative maximum intensity z-projections from 3D image stacks of MCF7s in each hydrogel formulation after 15 days in culture. Cells were fixed and fluorescently labeled for phosphorylated p38 (red:p-p38), phosphorylated ERK (green: p-ERK), and counterstained with Hoechst (blue: nuclei). Scale Bar = 100 µm. Quantification of (B) p-ERK mean fluorescence intensity, (C) p-p38 mean fluorescence intensity, and (D) p-ERK:p-p38 mean fluorescence ratio for MCF7s after 15 days in culture in the indicated hydrogel formulation. Results indicate decreased p-ERK expression accompanied by increased p38 expression in non-permissive-niche-1 and −2. * indicates statistically significant difference (p<0.05). n=6 z-stacks from 6 individual hydrogels. Values represent mean + standard deviation.
2.9. Classifying Hydrogel-Induced Cell Phenotype
To determine how each niche altered MCF7 phenotype, we implemented a previously described multimetric analysis based on well-established dormancy metrics and the anticipated behavior of MCF7s in either a growth or dormant state (Figure 9).[16]
Figure 9: Hydrogel-Induced Phenotype Characterization.
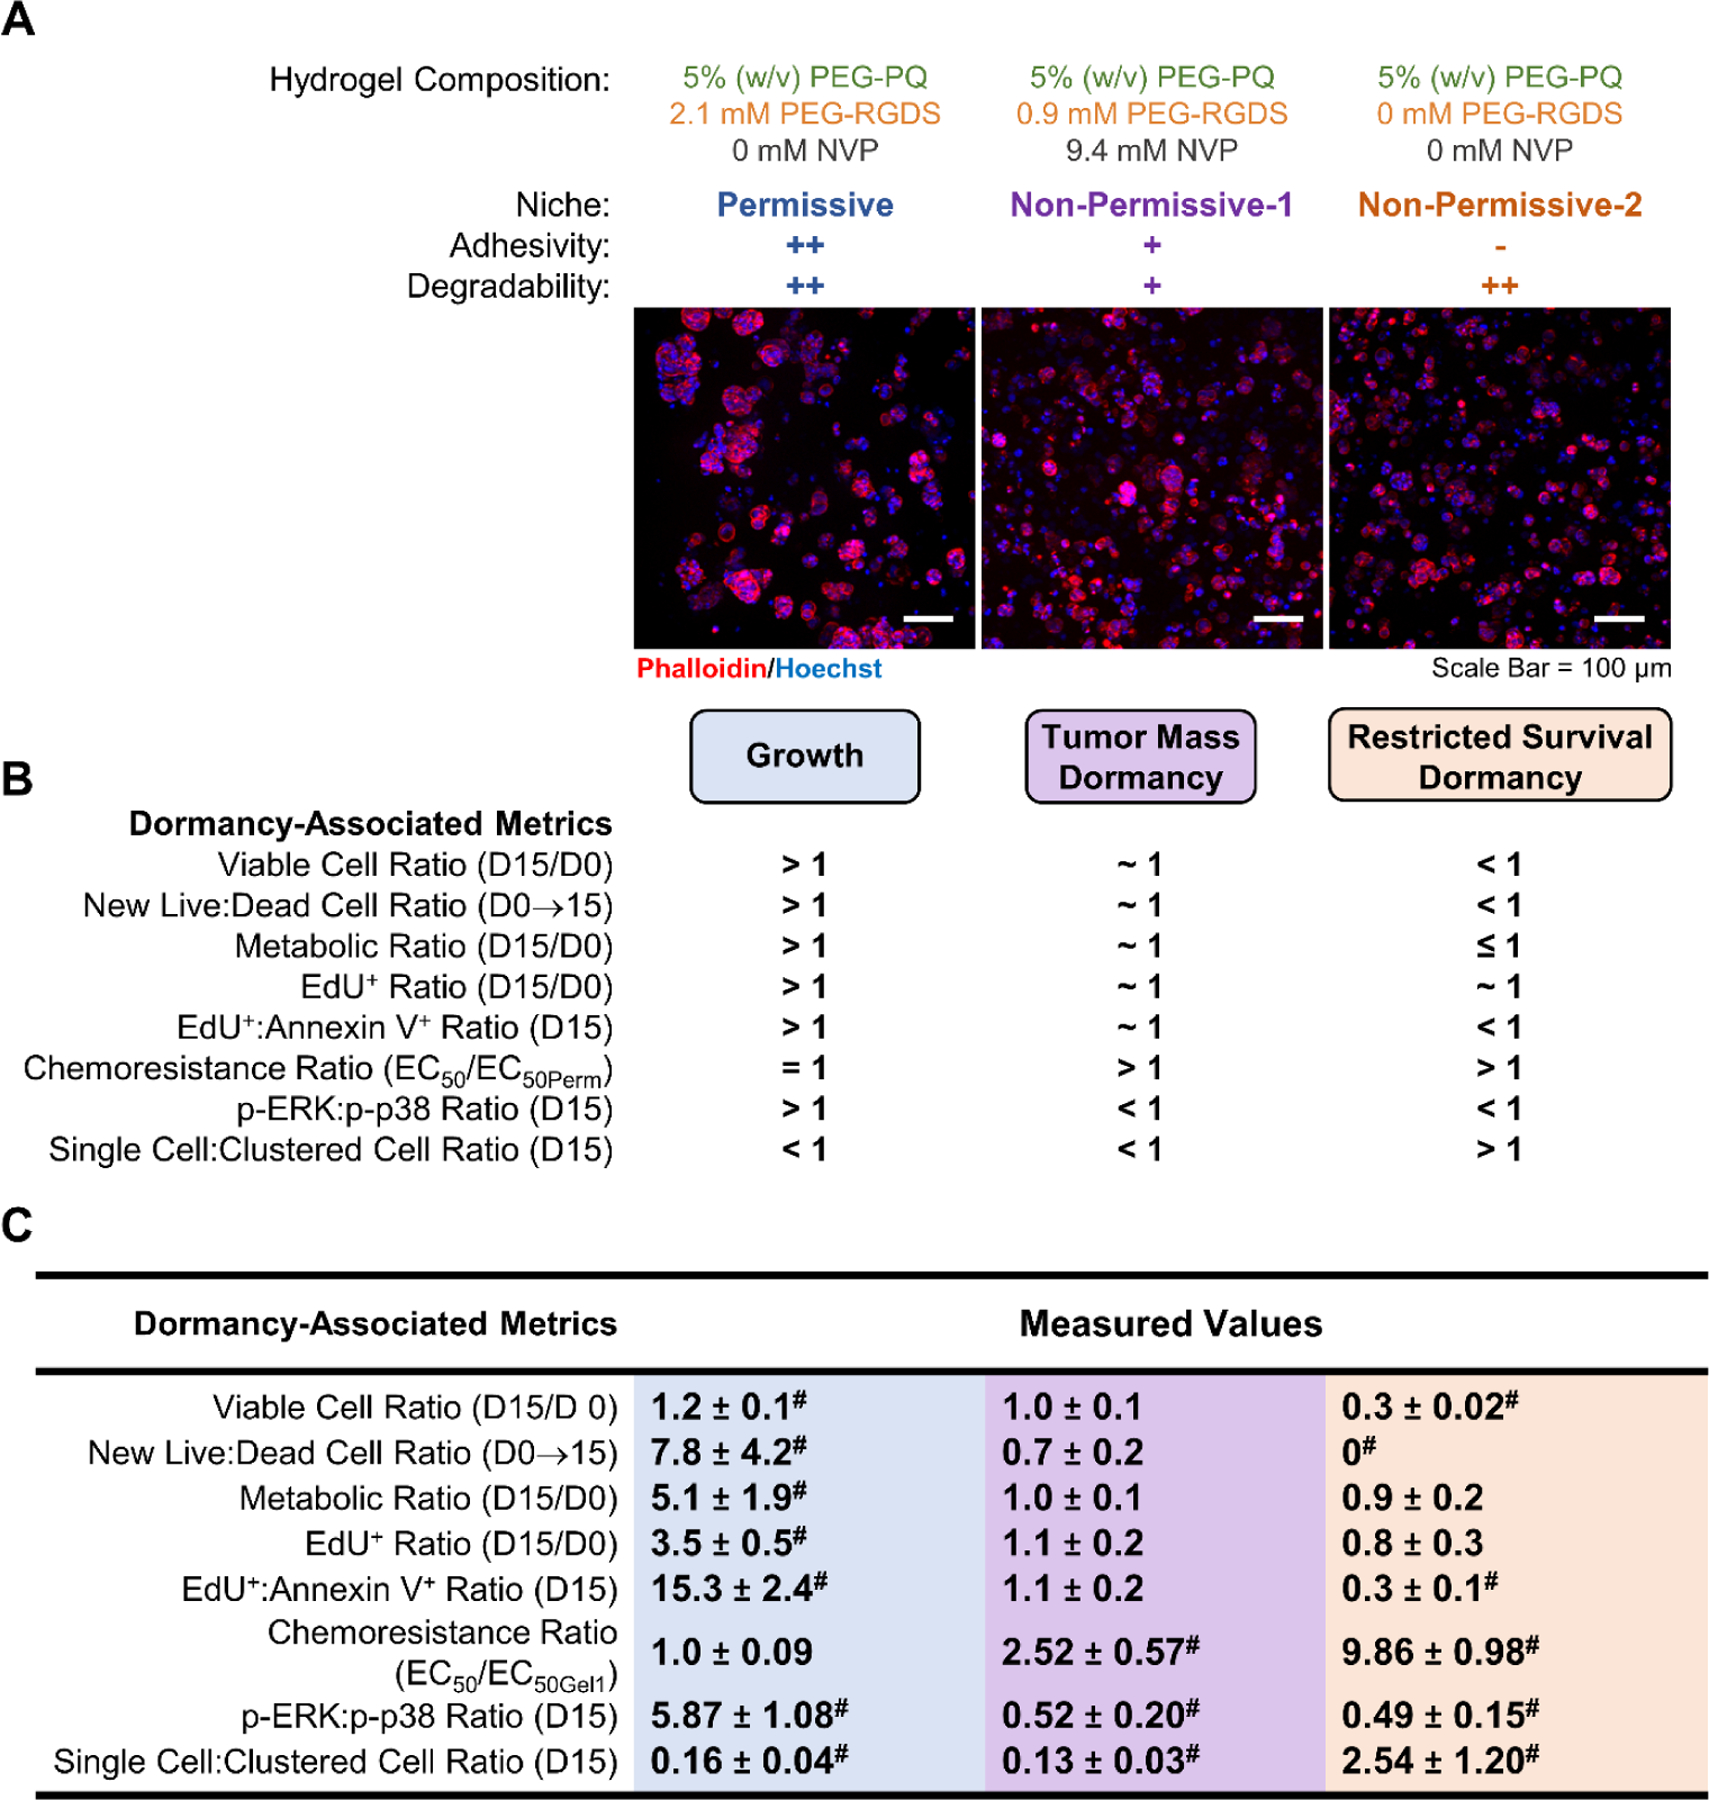
(A) Representative maximum intensity z-projections from 3D image stacks of MCF7s after 15 days in culture in each hydrogel formulation. Cells were fluorescently labeled with phalloidin (red: F-actin) and counterstained with Hoechst (blue: nuclei). Scale bar = 100 μm. (B) Hydrogel-induced phenotypes were defined via anticipated cell behavioral values for cells undergoing growth, tumor mass dormancy, or restricted survival dormancy. (C) Values for measured metrics and classified phenotypic states. The highlighted values indicate that the cells reside in the following states: growth (blue), tumor mass dormancy (purple), or restricted survival cellular dormancy (yellow). # indicated measured metrics that were statistically significantly (p<0.05) different than the value 1.
In the permissive niche (++ adhesivity, ++ degradability), MCF7s formed large, round clusters, and displayed a significant increase in the number of viable cells on day 15 compared to day 0 (>1 viable cell ratio), indicating proliferation. Similarly, MCF7s in the permissive niche had significantly more new live cells post day 0 compared to new dead cells post day 0 (>1 new live: new dead cell ratio) demonstrating that proliferation outpaced cell death and that the overall cell population was increasing over time (Figure 9). This increase in live cell density corresponds with a significant increase in metabolic activity observed between day 15 and day 0. Based on these metrics, we classified MCF7s in the permissive niche as residing in a growth state (Figure 9).
In non-permissive niche-1 (+ adhesivity, + degradability), MCF7s formed smaller, round clusters, and showed no significant change in the number of viable cells present over 15 days in culture, indicating a temporal balance in viable cell density, a characteristic one would anticipate from cells in a balanced, dormant state (Figure 9). MCF7s in non-permissive niche-1 also showed no significant difference in the number of new live and dead cells which further supports that non-permissive niche-1 induced a delicate balance between cell proliferation and apoptosis. In this niche, MCF7s were further confirmed to be in balanced dormancy as there was no significant change in metabolic activity or the number of proliferating cells at day 15 compared to day 0 (~1 metabolic ratio and ~1 EdU+ ratio). The EdU+:Annexin V+ ratio also confirmed that at day 15, there was a balance in the number of proliferating and apoptotic MCF7s. We also assessed chemoresistance and the p-ERK:p-p38 ratio. In non-permissive nice-1, MCF7s displayed increased chemoresistance and a decreased p-ERK:P-38 ratio compared to cells in the growth state induced by the permissive niche. Taken together, MCF7s in non-permissive niche-1 fulfilled all the anticipated behavior and thus were classified as residing in balanced tumor mass dormancy (Figure 9).
MCF7s in non-permissive niche-2 (- adhesivity, ++ degradability) resided as solitary, single cells. In contrast to the other niches investigated, there were significantly fewer viable cells at day 15 compared to day 0 in non-permissive niche-2 and no new live cells, indicating the anticipated behavior of cells residing in restricted survival, cellular dormancy where most cells undergo apoptosis (Figure 9). Restricted survival was further indicated by no significant increase in metabolic activity or number of EdU+ cells at day 15 compared to day 0. The ratio of apoptotic to proliferating cells further showed that there were significantly more cells undergoing programmed cell death compared to proliferation. This indicates that MCF7 survival in non-permissive niche-2 was restricted since cell death was higher than proliferation. Dormancy-associated metrics including increased chemoresistance (compared to the permissive niche) and a decreased p-ERK:p-38 ratio in was also observed. Based on these results, we classified MCF7s to be in restricted survival, cellular dormancy in non-permissive niche-2 (Figure 9).
2.10. Reactivation – Escape From Dormancy
A key property of dormant cancer cells is the ability to escape dormancy and resume proliferation, known as reactivation. To determine if dormant MCF7s can exhibit this change in phenotype, cells in non-permissive niche-2 were cultured to day 15 to achieve dormancy. After 15 days in culture, the cell-laden hydrogels were soaked in a solution containing 10 mM PEG-RGDS and 10 mM LAP followed by photocoupling of PEG-RGDS to the PEG-PQ hydrogel effectively converting non-permissive niche-2 into the permissive niche as previously described.[14,15] Cells were further cultured for 7 days (total of 22 days), and viability and proliferation were quantified to assess changes in phenotype. Viability significantly increased from 42.5 ± 2.5% at day 15 in non-permissive niche-2 (0 mM PEG-RGDS) to 85.6 ± 2.0% at day 22 (7 days post PEG-RGDS incorporation) (Figure 10). Similarly, the number of viable cells increased by 2.23 ± 0.20-fold at day 22, compared to day 15 (Figure 10C). Proliferation also increased from 12.8 ± 4.3% at day 15 to 49.5 ± 2.5% at day 22 (Figure 10A,B). The number of EdU+ cells present at day 22 increased by 5.93 ± 1.04-fold compared to those present at day 15, prior to PEG-RGDS incorporation (Figure 10C). Together, these measured values indicate that dynamic RGDS photocoupling can reactivate dormant cells in non-permissive niche-2, likely through integrin ligation.
Figure 10: Reactivation of Dormant Cells.

MCF7s were encapsulated and cultured in the non-permissive-2 hydrogel (0 mM PEG-RGDS, 0 mM NVP) for 15 days. PEG-RGDS was dynamically incorporated into the hydrogel via photocoupling and the cell-laden hydrogels were cultured for an additional 7 days (day 22 total). (A) Representative maximum intensity z-projections from 3D image stacks of [top row: live (calcein AM: green) and dead (ethidium homodimer: red)] and [bottom row: proliferating (EdU+:red and nuclei: blue)] MCF7s after the indicated culture time in the indicated hydrogel (left column: 15 days in non-permissive-2 and right column: 7 days post reactivation). Quantification of the (B) percentage of viable and proliferating (EdU+) cells at days 15 and 22 and the (C) fold change in the number of viable or EdU+ cells between day 22 (7 days post reactivation) and day 15. Dashed line represents a ratio of 1 (no change in the number of viable or proliferating cells post day 15). (B) * indicates statistically significant difference (p<0.05).) PEG-RGDS incorporation reactivated MCF7s in non-permissive niche-2 as indicated by significant increases in viability and proliferation. # indicates statistically significant difference (p<0.05) from the value 1. n=6 z-stacks from 6 individual hydrogels. Values represent mean + standard deviation.
3. Discussion
The latency period between initial diagnosis and treatment of a primary breast cancer tumor and detectable metastases can range from years to decades for metastatic breast cancer depending on receptor status with ER+ cancer cells remaining in a dormant state longer.[3] During this period, DTCs enter a dormant state in which viable cells either do not proliferate or achieve a near perfect balance between proliferation and death due to residing in a new unfavorable niche.[4] Over time, dormant cells can become reactivated leading to the formation of new tumors in distant organs.[8] While patient survival rates drop once relapse is confirmed,[2] tumor dormancy provides a potential “window of opportunity” to either eliminate dormant DTCs or prevent their reactivation to ultimately prevent metastatic relapse. However, current chemotherapeutic approaches fail to effectively treat dormant cells,[10] largely in part because cancer dormancy and reactivation remain an elusive process. To investigate breast cancer dormancy, in vitro platforms that provide the resolution required to perform mechanistic studies are essential. Furthermore, in the context of breast cancer, understanding the mechanisms driving ER+ dormancy is relevant as ER+ breast cancer has longer latency periods and thus provides an extended “window of opportunity” for treatment compared to other receptor statuses.[3] Towards this effort, we developed, characterized, and implemented a 3D, hydrogel platform to induce distinct forms of dormancy in the ER+ MCF7 breast cancer cell line.
The logic for our platform is based on cell-matrix interactions that occur in the early stages of infiltration of distant sites (secondary organs) in vivo. The premetastatic niche plays a significant role in determining cancer cell fate whether it be proliferation and tumor formation, death, or dormancy.[43,44] In a favorable niche, ECM components including proteins and proteoglycans promote cell-matrix interactions that allow cells to adhere, invade, migrate, proteolytically degrade their local matrix, and proliferate to form new tumors. These integrin-mediated cell adhesions promote cancer cell survival via activation of downstream pathways. An unfavorable niche that restricts these interactions including limited matrix adhesivity and degradability do not promote proliferation and instead can induce dormancy. With this logic, in vitro studies have achieved ECM-induced dormancy by limiting cell-matrix interactions including matrix degradation via cell confinement.[9,14,16,45–48] Hydrogels have been widely implemented to develop tissue engineered constructs that mimic various aspects of the tumor microenvironment.[5,19–29] For instance, natural hydrogels have been implemented to model the tumor microenvironment using proteins such as collagen, gelatin, and fibrin and polysaccharides such as hyaluronic acid and alginate have been incorporated to produce semi-synthetic hydrogels.[49–51] While these hydrogels provide relevant biochemical properties, batch to batch variability, viscosity, and limitations concerning independent control of mechanical and biochemical properties are often challenging obstacles to overcome with when using these materials. Synthetic polymers, such as the PEG-based hydrogels implemented here are bioinert, thereby providing a “blank slate” and attractive for use in modeling tumor niches.[49] Furthermore, the biochemical and mechanical properties of PEG-based hydrogels can be easily tuned to regulate cell adhesion, enzymatic degradation, or other properties of interest.
In this platform, the backbone of the hydrogel is composed of PEG-PQ, which cells can degrade via expression of proteases MMP-2 and −9. Incorporation of PEG-RGDS provides a cell ligating peptide that promotes cell adhesion. Incorporation of NVP results in the formation of non-degradable crosslinks in the PEG-PQ hydrogels which can induce cell confinement via decreased matrix degradability. The NVP concentrations used in this study were based on our previous studies that quantified the response of triple negative breast cancer cells, MDA-MB-231s, to 16 different hydrogel formulations with varying concentrations of PEG-RGDS and NVP.[14] Of these formulations, we chose 3 that induced growth and distinct forms of dormancy in MDA-MB-231s. The permissive niche used here contained 2.1 mM PEG-RGDS and 0 mM NVP. This niche provided a high concentration of cell ligating peptide (PEG-RGDS) and a high level of degradability due to the absence of non-degradable crosslinks since no NVP was included. Thus, this permissive niche was characterized as having high (++) adhesivity and high (++) degradability. This niche mimics a favorable niche in which cells can ligate to, and degrade the surrounding matrix, leading to downstream signaling that promotes growth. Quantification of hydrogel properties including a degradation assay and compression testing described in earlier sections indicated that the permissive niche had a degradation rate of 0.0125 ± 0.0006 min−1 and a compressive modulus of 4.2 ± 0.6 kPa for cell-laden gels after 15 days in culture.
Non-permissive niche-1 contained 0.9 mM PEG-RGDS and 9.4 mM NVP. This hydrogel had reduced ligand (RGDS) density and also reduced degradability due to the addition of non-degradable crosslinks via NVP incorporation. Thus, non-permissive niche-1 was characterized as having moderate adhesivity (+) and low (−) degradability. This niche mimicked an unfavorable niche in which cells can adhere to the surrounding matrix but do not express the appropriate proteases required to locally degrade the matrix. This hydrogel had a significantly lower degradation rate of 0.0081 ± 0.0016 min−1 and higher compressive modulus of 7.6 ± 0.8 kPa, compared to the permissive niche.
Non-permissive niche-2 contained 0 mM PEG-RGDS and 0 mM NVP. Non-permissive niche-2 had no adhesivity (−) but high degradability (++). This niche mimicked an unfavorable case in which cells express the correct proteases to degrade their surrounding matrix but fail to form cell-matrix adhesions. Since no NVP was added and PEG-RGDS does not significantly alter hydrogel elasticity, non-permissive niche-2 had the same degradability (0.0125 ± 0.0006 min−1) and compressive modulus (4.2 ± 0.6 kPa) as the permissive niche. Our study uses the terms “permissive” and non-permissive” in reference to changes in ECM degradability and adhesivity that influence cell-matrix interactions; however, it is important to note that a permissive niche can be regulated by many factors including secondary cell types and soluble factors such as nutrients and oxygen which are of interest for future studies
To quantify how each niche influenced the phenotype of MCF7s, cells were serum starved 48 hr prior to encapsulation. This was done to synchronize the cell cycle and allow cells to start off in a similar quiescent state, making it easier to compare cell fate changes induced by the three distinct hydrogel formulations over time. We quantified dormancy-associated phenotypic changes including changes in viability, proliferation, apoptosis, metabolic activity, chemoresistance, and the p38:ERK ratio, as have been previously used by others.[33,45,46] The first metric examined was the viable cell ratio, defined as the number of viable cells at day 15 divided by the number of viable cells at day 0. This was chosen as the ground truth metric because logically, one would anticipate an increase in the viable cell population for MCF7s in a proliferative, growth state. While dormant cells would either maintain a constant cell population with no significant change in viable cells (~1) over time or potentially a decrease in the viable cell population (<1) if significant apoptosis was occurring in an unfavorable niche. Supporting metrics which quantified other dormancy-associated phenotypic changes throughout the 15 day culture period were also implemented for classification. These metrics included the new live:new dead ratio which quantified the balance between cell survival and death, metabolic ratio which indicated changes in metabolic activity, EdU+ ratio which quantified changes in proliferation, and the EdU+:Annexin V+ ratio which determined the relationship between cell proliferation and apoptosis. We also measured dormancy-associated chemoresistance to DOX, as it has been established that current chemotherapeutics that target proliferating cells do not effectively eliminate dormant cancer cells.[9,10] It is important to make the distinction that chemoresistance alone does not indicate dormancy. Furthermore, we cannot rule out the possibility that other factors including morphology, or other characteristics not typically associated with dormancy, play a role in the measured drug response. Thus, we implement this data alongside viability, proliferation, apoptosis, and metabolic activity as a supporting metric as presented in Figure 9. We also quantified the expression of an established dormancy marker, the p-ERK:p-38 ratio. This ratio has been validated as a predictor of whether cells will enter dormancy in vivo.[40,41]
Results indicated that high adhesivity and degradability afforded by the permissive niche promoted significant increases in the viable cell population through proliferation, leading to the formation of larger, highly metabolically active, cell clusters (50.4 ± 16.6 µm diameter). In previous studies using triple negative breast cancer cells, MDA-MB-231s, the permissive niche promoted the formation of clusters with filopodial protrusions. In the case of MCF7s, clusters were round likely due to the origin of the MCF7 cell line which was derived from the pleural effusion of a 69-year-old woman and thus has retained many epithelial characteristics.[52] Decreasing adhesivity and matrix degradability in non-permissive niche-1 resulted in smaller cell clusters (37.2 ± 9 µm). While this unfavorable niche did not promote growth, MCF7s managed to survive in a balanced state with no significant temporal changes in the number of viable or proliferating cells. Data acquired from day 15 demonstrated a near perfect balance between proliferation and apoptosis. Based on these results, MCF7s in non-permissive niche-1 were characterized to be in tumor mass dormancy. This characterization was supported by increased chemoresistance to DOX and overexpression of p38 compared to p-ERK. In our previous studies,[16] non-permissive niche-1 induced cellular dormancy in the MDA-MB-231 parental line and lung-tropic 231s as these cells did not form clusters, while tumor mass dormancy was induced in brain-tropic and bone-tropic 231s. In non-permissive niche-2, the absence of ligands had a significant effect on cell survival with only 42.5 ± 2.5% viability at day 15. MCF7s in this niche resided as mostly solitary single cells, with significantly more cells undergoing apoptosis compared to proliferation at day 15. These results resemble behavior observed in vivo in which >90% of cells that infiltrate secondary organs undergo apoptotic death while few surviving cells survive in a dormant state.[6,53] Due to this sharp decrease in survival, MCF7s were characterized as being in restricted survival, cellular dormancy when cultured in non-permissive niche-2, indicating the dependence of cell survival on matrix adhesion. It is worth noting that based on our viability data, only 43% of cells present at day 0 remain viable at day 15 in non-permissive niche-2. Thus, one would anticipate that the metabolic ratio would also be ~0.43, instead of the 0.92 ± 0.17 measured. Interestingly, previous studies in MDA-MB-231s encapsulated in non-permissive niche-2 also indicated a ~1 metabolic ratio at low viability values (~40%), while three organotropic lines cultured in this niche displayed no significant change in metabolic activity or viable cell density indicating that these changes may depend on cell type as well as matrix properties. While detection limitations may lead to differences in anticipated results, we do not anticipate that this played a role here as the lowest measurement in our cell-laden hydrogels was 50-fold higher than our hydrogel only control meaning that that the metabolism may indeed be higher than expected. A potential reason for our findings is that it has been shown that dormant cells may undergo “metabolic reprogramming” in which they switch from oxidative phosphorylation to glycolysis to survive in a new microenvironment[54,55]. Another potential reason could be that surviving cells in non-permissive niche-2 may be going through a form of hypermetabolism such as increased glucose intake, which is a common response that occurs in cancer patients and is often accompanied by poor diagnosis.[34,35,56] Similar results were obtained for the parental MDA-MB-231s, while organotropic lines were able to survive these conditions in balanced cellular dormancy likely due to their pro-survival gene expression.[16] These results highlight how matrix adhesion can play a significant role in dormancy and growth across different cell lines with different receptor statuses.
In this study we did not implement organ-specific formulations but took the approach of mimicking generic niches that either promoted or suppressed the formation of integrin-mediated adhesions and allowed for or restricted matrix degradability. The results demonstrate that promoting integrin ligation in conjunction with high matrix degradability promotes MCF7 proliferation and survival in the permissive niche. Reducing ligand density and decreasing matrix degradability with non-permissive niche-1 confined MCF7s into smaller, dormant clusters which remained in a balanced survival state. The removal of integrin ligating peptide in non-permissive niche-2 resulted in significant cell death accompanied by solitary, dormant cells.
Key to understanding how ECM composition influences dormancy, is understanding its role in the exit from dormancy or reactivation; which ultimately leads to metastatic relapse. While relapse can occur from multiple factors including signaling from stromal cells and angiogenesis, matrix remodeling can also lead to cell-matrix interactions that promote a phenotypic switch.[57] Thus, to further understand how ECM composition can alter cancer cell fate, dormancy was induced in MCF7s for 15 days via culture in non-permissive niche-2, PEG-RGDS was photocoupled into the hydrogel at day 15, and the cell-laden hydrogels were cultured for an additional 7 days (total of 22 days in culture). Results demonstrated that MCF7 viability increased from 42.5 ± 2.5% at day 15 (dormant state) to 85.6 ± 2.0% at day 22 (reactivated). Similarly, there was a 2.23 ± 0.20-fold increase in the number of viable cells and a 5.93 ± 1.04-fold increase in the number of proliferating cells. Thus, these results indicate the ability to reactivate dormant MCF7s via a dynamic increase in hydrogel adhesivity in situ.
This study also provides insight into the factors that induce and regulate both dormancy and reactivation of ER+ breast cancer cells in the premetastatic niche. Several factors in the pre-metastatic niche have been shown to play a role in dormancy including secondary cell signaling, nutrient deprivation, and hypoxia. In this study, we focused on ECM properties during early infiltration of a secondary niche before secondary cell types and immune cells are able to influence DTC fate. However, future studies in which these factors are included to investigate later stages of metastatic progression are of interest.
While we varied ligand density and degradability to model a general permissive or non-permissive niches, it is worth noting that there were differences in hydrogel elasticity, with non-permissive niche-1 having a significantly higher compressive modulus due to NVP incorporation. While we cannot confirm that this may play a role in the phenotypic changes observed, our previous data indicates that ligand density and hydrogel degradability have a more significant influence on cell fate, at least in the ranges of elasticity used here. This assumption is based on one of our previous studies in which a larger hydrogel landscape of 16 formulations with varying properties was implemented.[13–15] Those findings showed that differences in elasticity played a minor role in regulating cancer cell fate compared to changes in hydrogel adhesivity and degradability but the influence of differences in elasticity cannot be completely ruled out as an influence and warrant further study in the future. A limitation of our chemistry is that hydrogel degradability and elasticity are coupled, thus to confirm this notion, future studies that a use multi-arm PEG to independently tune hydrogel degradability and elasticity are of interest.
While we thoroughly characterized MCF7 phenotype using dormancy-associated metrics, differences in hydrogel-induced genotype were not assessed in this study. Understanding genotype can provide valuable insight into hydrogel-induced differences between growing and dormant populations, and between distinct forms of dormancy. Studies have shown that genes involved in cell cycle progression, differentiation, and motility can be differentially expressed in dormant cells.[17] Additionally, genetic profiles can be used to validate in vitro dormancy models by comparing in vitro expression to known levels observed in vivo.[46]
In varying hydrogel formulations, we confirmed that matrix properties such as pore size did not impact cell behavior by reducing transport. We previously confirmed that there was no significant difference in the transport of 3 kDa dextran between the permissive niche and non-permissive niches implemented here.[14] Thus, one can assume no limitations or difference in the transport of small molecules including nutrients and oxygen in this study. To also confirm that hydrogel volume did not limit transport, hydrogel height was controlled to a thickness of 500 µm. This height is below the distance that has been shown to limit oxygen and nutrient deprivation, and thus we believe that transport limitations were not present and did not play a role in phenotypic differences observed in this study.
Overall, results in this study show the development and characterization of an easy-to-use, 3D, hydrogel platform to induce growth, distinct forms of dormancy, and reactivation in ER+ breast cancer cell line, MCF7s. Future implementation of this platform can be used to quantify and understand how chemoresistance in imparted in dormant breast cancer and screen new therapeutic approaches to eliminate dormant cancer to aid in preventing metastatic relapse.
4. Conclusion
Reactivation of dormant breast cancer leads to metastatic relapse and poor patient outcome. Fortunately, this latency period provides a “window of opportunity” to target and eliminate dormant cells prior to their reactivation to prevent metastatic relapse. A significant obstacle towards this goal is the poor efficacy of current chemotherapeutics in eliminating dormant cancer cells. Towards the effort to develop new therapeutic strategies for dormant breast cancer, we developed and thoroughly characterized an in vitro platform to mimic general favorable or unfavorable pre-metastatic niches that DTCs encounter during early stages of infiltration of secondary tissues/organs. By tuning matrix adhesivity and degradability, we induced three distinct phenotypic states. The permissive niche (++ adhesivity, ++ degradability) promoted MCF7 survival and growth. Non-permissive niche-1 (+ adhesivity, + degradability) mimicked a case in which cells can form adhesions but are unable to easily degrade their surrounding matrix. These conditions led to balanced tumor mass dormancy in which cells survived with a near perfect balance between proliferation and apoptosis. Mimicking a niche in which cells were unable to form cell-matrix adhesions, non-permissive niche-2 (- adhesivity, ++ degradability) resulted in restricted survival, cellular dormancy. We also demonstrated the ability to reactivate dormant MCF7s in situ, an important process towards understanding metastatic progression. Overall, these findings provide insight into how the matrix properties of foreign premetastatic niches can influence MCF7 phenotype to induce growth, distinct forms of dormancy, and reactivation. Additionally, this work provides a platform to perform mechanistic studies on dormant and reactivated cells to aid in the development of novel therapeutic strategies that can eliminate dormant breast cancer and prevent metastatic relapse.
5. Experimental Section
5.1. Cell Culture
The ER+ breast cancer line, MCF7, was purchased from American Type Culture Collection (ATCC). MCF7s (passage 7–10) were cultured to 80% confluency in fibronectin coated (10 μg/mL) T75 flasks using Dulbecco’s Modified Eagle Medium (DMEM: Thermo Fisher) supplemented with 10% (v/v) fetal bovine serum (FBS: Thermo Fisher) and 1% (v/v) penicillin-streptomycin (Lonza) at 37 °C and 5% CO2. While MCF7s are poorly metastatic in animal models,[52,58,59] this cell line was chosen as a representative ER+ breast cancer cell line as ER+ breast cancer is more likely to enter and remain in dormancy for long periods of time ranging from5 to 20 years,[17,18] providing a clinically relevant window of time to treat and eliminate dormant ER+ breast cancer cells. To synchronize the cell cycle, cells were serum starved in serum-free DMEM for 48 hr prior to hydrogel encapsulation.
5.2. PEG Macromer Synthesis and Characterization
Synthesis of the proteolytically-degradable, diacrylated PEG macromer, PEG-PQ-PEG (PEG-PQ), and the integrin-ligating monoacrylated PEG macromer, PEG-RGDS, was conducted as previously described.[14,15] Briefly, to form PEG-PQ, 3400 Da acrylate-PEG-SVA (Laysan Bio) was reacted with the metalloproteinase-2 and −9 proteolytically degradable peptide sequence GGGPQG↓IWGQGK (PQ, MW: 1141.24 Da, Biopeptek, ↓ denotes cleavage site) at a 2.1:1 (PEG-SVA:PQ) molar ratio in dimethyl sulfoxide (DMSO) and N,N-diisopropylethylamine (DIPEA) (4:1 DIPEA:PQ molar ratio) at room temperature for 48 hr. PEG-RGDS was formed by reacting acryl-PEG-SVA to the integrin ligating peptide, RGDS, (MW: 433.42 Da, Biopeptek) at a 1.1:1 (PEG-SVA:RGDS) molar ratio in DMSO and DIPEA (2:1 DIPEA:RGDS molar ratio). Products were purified using dialysis (DI water, 24 hr, MWCO 3500, Regenerated Cellulose, Spectrum Laboratories), frozen, lyophilized, and stored under argon at −80 °C until use. Verification of conjugation was achieved via gel permeation chromatography (GPC, Waters, aqueous phase).
5.3. Cell Encapsulation
The three precursor solutions that induced growth and distinct dormant states in parental and organotropic 231s were prepared as previously described.[14–16] Phosphate-buffered saline (PBS) was used to reconstitute PEG-PQ (MW: 7900 Da) to a final concentration of 5% weight/volume (w/v) (6.3 mM) for all hydrogel formulations. PEG-RGDS was reconstituted to final concentrations of 10 mM (permissive niche), 1 mM (non-permissive niche-1), or 0 mM (non-permissive niche-2) in phosphate buffered saline (PBS). N-vinyl pyrrolidinone (NVP) was added to the non-permissive-1 pre-polymer solution at a concentration of 1.0 μL/mL (9.4 mM). The photocrosslinker, lithium phenyl-2,4,6-trimethylbenzoylphosphinate (LAP), was added to all formulations at a final concentration of 3.0 mg/mL (10 mM). Cells were trypsinized, counted, and re-suspended in one of the three pre-polymer solutions at 10 million cells/mL. Cell-laden (3 µL) droplets were pipetted onto a perfluoroalkoxy alkane (McMaster-Carr) coated Petri dish. A glass slide was placed over the droplets with poly(dimethylsiloxane) (PDMS) spacers (500 μm thick) to control the hydrogel height. Hydrogels were photopolymerized using a 1 min exposure to broad spectrum UV (Blak-Ray flood UV lamp) with an intensity of 10 mW/cm2 measured at 365 nm. It is worth noting that while 10 mM or 1 mM PEG-RGDS was added to the hydrogel precursor solutions, the actual PEG-RGDS concentration incorporated into the hydrogel after photopolymerization was 2.1 ± 0.7 mM or 0.9 ± 0.1, respectively, due to differences in incorporation efficiency afforded by the presence or absence of NVP (described in Section 2.1). Cell-laden hydrogels were cultured in DMEM supplemented with 10% (v/v) FBS and 1% (v/v) penicillin-streptomycin for 15 days, with media changes every 4 days.
5.4. Hydrogel Elasticity
Hydrogel elastic moduli were measured using a Universal Testing System 3340 Series (Instron). Hydrogel prepolymer solutions were prepared with 5% PEG-PQ, 1 mM PEG-RGDS, and either 0 mM NVP or 9.4 mM NVP. After photopolymerization, acellular and cellular (10 million cells/mL) hydrogels (n=5, diameter = 3 mm, height = 1 mm) were allowed to swell to equilibrium in either PBS or media. Measurements were conducted for acellular hydrogels, cellular hydrogels at day 0 (12 hr post encapsulation), and cellular hydrogels at day 15. Compression tests were conducted with an initial load of 0.02 N at a rate of 2 µm/s for 100 s to reach 20% strain. The compressive modulus was determined from the slope of the linear portion of the stress-strain curve.
5.5. RGDS Incorporation
PEG-RGDS incorporation indicates the amount of PEG-RGDS added to the hydrogel prepolymer solution that was incorporated into the hydrogel matrix after photopolymerization. To quantify the concentration of PEG-RGDS incorporated into each hydrogel formulation, precursor solutions were prepared with 0 mM or 9.4 mM NVP, and fluorescence analysis was implemented as previously described.[14,15] Hydrogel precursors were prepared with a fluorescent variant, PEG-RGDS functionalized with AlexaFluor488 (PEG-RGDS-488). Precursors contained 5% PEG-PQ with 10 mM RGDS (0.5 mM PEG-RGDS-488 + 9.5 mM PEG-RGDS) and 0 mM NVP or 1 mM RGDS (0.5 mM PEG-RGDS-488 + 0.5 mM PEG-RGDS) and 9.4 mM NVP. Pre-polymer solutions were imaged prior to crosslinking to account for photobleaching, immediately after, and after 12 hr once hydrogels had swollen to equilibrium in PBS and any unconjugated RGDS had been washed away. The conjugation efficiency was quantified by comparing the intensity of PEG-RGDS-488 before and after rinsing. Using these values, the RGDS concentration in the hydrogel formulations was calculated as previously described.[14,15]
5.6. Hydrogel Degradability
To measure hydrogel degradability, PEG-PQ hydrogels containing 0 or 9.4 mM NVP (n = 6 gels for each formulation) were prepared in the presence of 1 mM methacryloxyethyl thiocarbamoyl rhodamine B (Polysciences), photocrosslinked, and allowed to swell to equilibrium in PBS overnight as previously described.[14,15] The hydrogels were placed in a well plate (1 gel/well) and incubated in either 100 μg/mL collagenase IV (Worthington, 250 U/mg) or PBS (control group) at 37 °C. Hydrogels were imaged at 20 min intervals for 220 min. The mean fluorescence intensity of the hydrogel and surrounding solution was quantified to determine hydrogel degradation over time. The relationship between relative hydrogel intensity (normalized to intensity at time 0) and time was plotted and the slope of the linear portion was used to quantify the degradation rate. Control groups in PBS were used to account for photobleaching.
5.7. Quantification of Cell Viability
Cell-laden hydrogels were labeled with a Live/Dead® cell viability kit (Invitrogen) at days 0 (6 hr post encapsulation) and 15 following the manufacturer’s instructions. For imaging, hydrogels were placed between coverslips within PDMS wells as previously described.[9,14–16] A Zeiss AxioObserver Z1 inverted fluorescent microscope equipped with a Zeiss Apotome2 imaging system and a Hamamatsu ORCA-Flash 4.0LT camera was used to acquire fluorescent z-stacks (z-height: 150 µm) using structured illumination. Representative images were acquired by positioning the hydrogel at its approximate center and capturing z-stacks between the top and bottom surfaces. No limitations in oxygen transport were observed as the hydrogel height (500 μm) did not induce any oxygen or transport gradients.[15] FIJI software was used to count labeled cells and to quantify viability. A minimum of 6 z-stacks from 6 hydrogels were imaged and analyzed at each time point for each hydrogel formulation.
5.8. Quantification of Early Apoptosis
Early apoptosis was measured at days 0 (6 hr post encapsulation) and 15. Cell-laden hydrogels were rinsed with a binding buffer (HEPES-buffered saline (HBS) with 2.5 mM CaCl2) for 15 min. The hydrogels were incubated at 37°C for 30 min with a solution that labels the early apoptosis marker, CF568 Annexin V (Biotium, 1 µg/mL), and a nuclear counterstain, Hoechst 33342 (10 µg/mL). After rinsing with binding buffer, cells were imaged using structured illumination as described in Section 5.7. The percentage of Annexin V positive cells was quantified using FIJI software. A minimum of 6 z-stacks from 6 hydrogels were imaged and analyzed at each time point for each hydrogel formulation.
5.9. Quantification of Proliferation
Proliferation was measured at days 0 (6 hr post encapsulation) and 15 via 5-ethynyl-2-deoxyuridine (EdU) incorporation using a Click-It® EdU Imaging Kit (Invitrogen) according to the manufacturer’s instructions. Cell-laden hydrogels were incubated with 10 µM EdU in medium for 24 hr at 37°C, rinsed with PBS, and fixed with 4% paraformaldehyde (PFA) (room temperature, 30 min). Cells were permeabilized in PBS-T (PBS + 0.2% (w/v) bovine serum albumin (BSA) +0.1% (v/v) Triton-X, 30 min), and blocked with blocking buffer (PBS + 3% (v/v) FBS, 30 min). AlexaFluor 647-azide was used to label proliferating nuclei, and Hoechst 33342 (nuclei) was used as a counterstain. To quantify the percentage of AlexaFluor 647 positive nuclei, imaging and analysis were performed as described in Section 5.7. A minimum of 6 z-stacks from 6 hydrogels were imaged and analyzed at each time point for each hydrogel formulation.
5.10. Quantification of Metabolic Activity
An Alamar Blue assay (Thermo Fisher) was used to measure metabolic activity on days 0 (6 hr post encapsulation) and 15. Cells were cultured in phenol-free media. After rinsing with PBS, hydrogels were incubated in a working solution of Alamar Blue (10 μL of 10X stock + 100 μL phenol red-free media) for 4 hr at 37°C. Hydrogels were transferred into new well plates with phenol red-free media. To quantify relative metabolic activity, the fluorescence intensity was measured using a plate reader (Biotek Synergy, Excitation: 550 nm, Emission: 600 nm). Measured values were normalized to day 0 values. Controls with media and no hydrogels were used to account for background noise. A minimum of 6 hydrogels were imaged and analyzed at each time point for each hydrogel formulation.
5.11. Quantification of Cell and Cell Cluster Properties
Cell-laden hydrogels were rinsed and fixed using 4% PFA (room temperature, 30 min) after 15 days in culture. Cells were permeabilized (PBS-T, 30 min), blocked (BSA blocking buffer: 2% w/v BSA in PBS, 30 min), fluorescently labeled with AlexaFluor568 Phalloidin (Invitrogen) (2.6 μg/mL, 1 hr), and counterstained with Hoechst 33342 (10 μg/mL, 30 min). Hydrogels were rinsed and imaged as described in Section 5.7. FIJI software was used to quantify the percentage of cells residing as individual cells or cell clusters, cells or clusters that were round or invasive (roundness value less than 0.80[14]) as well as the Feret’s diameter, aspect ratio, circularity, roundness, cluster density, and single cell density. Clusters were defined as more than 2 nuclei grouped together. A minimum of 6 z-stacks from 6 hydrogels were imaged and analyzed at each time point for each hydrogel formulation.
5.12. Quantification of Chemosensitivity to Doxorubicin
Doxorubicin (DOX) was purchased from Cayman Chemical and reconstituted in DMSO according to the manufacturer’s instructions. For chemosensitivity experiments, the 172.5 mM stock solution was diluted to a desired concentration (0.001, 0.01, 0.05, 0.1, 0.55, 1, or 2 mM) in media.[9,16] Vehicle controls (2% (v/v) DMSO) were used for all experiments. After 15 days in culture, the hydrogels were rinsed with PBS and transferred to a new well plate and exposed to varying concentrations of DOX. After 48 hr DOX exposure, hydrogels were rinsed and labeled with a Live/Dead® cell viability kit (Invitrogen). Cell-laden hydrogels were rinsed with PBS and imaged as described in Section 5.7. Due to the red autofluorescence of DOX, only live cells were imaged and counted. To quantify cell viability, the number of live cells in each experimental condition was normalized to the number of live cells measured in the vehicle control. A minimum of 6 z-stacks from 6 hydrogels were imaged and analyzed at each time point for each hydrogel formulation.
5.13. Quantification of p-ERK and p-p38 Expression
After 15 days in culture, cell-laden hydrogels were fixed (4% PFA, 30 min), blocked (5% (w/v) BSA, 0.3% (v/v) Triton X-100 in PBS, 30 min), and incubated overnight with phospho-p38 (p-p38) mitogen activated kinase (MAPK) (Thr180/Tyr182) primary mouse antibody (Cell Signaling) (1:200 in dilution buffer (1% (w/v) BSA, 0.3% (v/v) Triton X-100 in PBS, 4°C). Hydrogels were rinse with PBS and incubated with a goat anti-mouse IgG-AlexaFluor647 secondary antibody (1:500 in dilution buffer, 2 hr in the dark). Labeled hydrogels were rinsed and incubated overnight with a phospho-p44/42 MAPK (p-ERK) and ERK1/2 (Thr202/Tyr204) primary rabbit antibody (Cell Signaling) (1:200 in dilution buffer, 4°C). After rinsing with PBS, hydrogels were incubated with a goat-anti rabbit IgG-AlexaFluor488 secondary antibody (1:500 in dilution buffer, 2 hr in the dark), counterstained with 10 µg/mL Hoechst 33342 (nuclei) (30 min) and stored in PBS. Labeled hydrogels were imaged as described in Section 5.7. Intensity values were acquired as previously described.[9,14–16] For each z-stack, a maximum intensity z-projection was acquired. The mean fluorescence intensity of each projection was measured to quantify p-p38, p-ERK, and the p-ERK to p-p38 ratio. To account for background noise, five background regions that did not contain cells were measured, averaged, and subtracted from each z-projection. A minimum of 6 z-stacks from 6 hydrogels were imaged and analyzed at each time point for each hydrogel formulation.
5.14. Reactivation of Dormant Cells
Reactivation of dormant MCF7s was performed as previously described.[14,16] MCF7s were grown in non-permissive niche-2 (5% w/v PEG-RQ, 0 mM PEG-RGDS, 0 mM NVP) for 15 days to achieve dormancy. At day 15, hydrogels were rinsed with PBS, and incubated in a solution composed of 10 mM PEG-RGDS and 10 mM LAP at 37°C. After a 1 hr incubation period that allowed PEG-RGDS to diffuse into the hydrogel, broad spectrum UV was used to photocouple the PEG-RGDS to the hydrogel. Unbound PEG-RGDS was rinsed away with PBS, and cells were cultured for an additional 7 days post coupling (total: 22 days). Cell viability and proliferation were measured at day 22 as described in section 5.7 and 5.9. A minimum of 6 z-stacks from 6 individual hydrogels were imaged and quantified for the four cell lines.
5.15. Statistical Analysis
Minitab 17 Statistical Software (Minitab Inc.) was used to perform statistical analysis. Assumptions of normality were evaluated via an Anderson-Darling test. Equal variance was evaluated via a Levene’s test (p>0.05). Statistical comparison between multiple groups was analyzed using a one-way analysis of variance (ANOVA). To determined statistical significance, Tukey Kramer was used in cases of equal variance and a Howell post-hoc in cases of unequal variance. For comparison between two groups, a 2-sample t-test was used. A p-value < 0.05 was considered statistically significant in all tests. To obtain sigmoidal dose-response curves, OriginLab software was used with a dose response function and a Levenberg Marquardt iteration algorithm.
Supplementary Material
Acknowledgements
This work was supported by a grant from the National Institutes of Health (R21CA214299). C.J.F.R was supported by a University of Delaware Graduate Scholar Award. Confocal microscopy was provided by the Bio-Imaging Center in the Delaware Biotechnology Institute, supported with grants from the NIHNIGMS (P20 GM103446), the NSF (IIA 1301765), and the State of Delaware.
Footnotes
Supporting Information
Supporting Information is available from the Wiley Online Library or from the author.
Conflicts of Interest
The authors declare no conflicts of interest.
References
- [1].Cancer Facts & Figures 2019 American Cancer Society. (2019). [Google Scholar]
- [2].American Society of Clinical Oncology. Breast Cancer - Metastatic: Statistics (2021).
- [3].Gomis RR, Gawrzak S Tumor cell dormancy. Molecular Oncology, 62–78 (2017). [DOI] [PMC free article] [PubMed]
- [4].Aguirre-Ghiso JA Models, mechanisms and clinical evidence for cancer dormancy. Nature reviews. Cancer 7, 834–846, doi: 10.1038/nrc2256 (2007). [DOI] [PMC free article] [PubMed] [Google Scholar]
- [5].Pradhan S, Sperduto JL, Farino CJ & Slater J. H. J. J. o. B. E. Engineered In Vitro Models of Tumor Dormancy and Reactivation 12, 37, doi: 10.1186/s13036-018-0120-9 (2018). [DOI] [PMC free article] [PubMed] [Google Scholar]
- [6].Naumov GN, MacDonald IC, Weinmeister PM, Kerkvliet N, Nadkarni KV, Wilson SM, Morris VL, Groom AC, Chambers AF Persistence of solitary mammary carcinoma cells in a secondary site: a possible contributor to dormancy. Cancer research 62, 2162–2168 (2002). [PubMed] [Google Scholar]
- [7].Naumov GN, Folkman J, Straume O, Akslen LA Tumor-vascular interactions and tumor dormancy. APMIS : acta pathologica, microbiologica, et immunologica Scandinavica 116, 569–585, doi: 10.1111/j.1600-0463.2008.01213.x (2008). [DOI] [PubMed] [Google Scholar]
- [8].Giancotti FG Mechanisms governing metastatic dormancy and reactivation. Cell 155, 750–764, doi: 10.1016/j.cell.2013.10.029 (2013). [DOI] [PMC free article] [PubMed] [Google Scholar]
- [9].Farino CJ, Pradhan S, Slater JH The Influence of Matrix Induced Dormancy on Metastatic Breast Cancer Chemoresistance. ACS Applied Bio Materials (2020). [DOI] [PMC free article] [PubMed]
- [10].Braun S, Kentenich C, Janni W, Hepp F, de Waal J, Willgeroth F, Sommer H, Pantel K Lack of effect of adjuvant chemotherapy on the elimination of single dormant tumor cells in bone marrow of high-risk breast cancer patients. Journal of clinical oncology : official journal of the American Society of Clinical Oncology 18, 80–86, doi: 10.1200/jco.2000.18.1.80 (2000). [DOI] [PubMed] [Google Scholar]
- [11].Doglioni G, Parik S & Fendt SM Interactions in the (Pre)metastatic Niche Support Metastasis Formation. Frontiers in oncology 9, 219, doi: 10.3389/fonc.2019.00219 (2019). [DOI] [PMC free article] [PubMed] [Google Scholar]
- [12].Ghajar CM Metastasis prevention by targeting the dormant niche. Nature reviews. Cancer 15, 238–247, doi: 10.1038/nrc3910 (2015). [DOI] [PMC free article] [PubMed] [Google Scholar]
- [13].Pradhan S & Slater JH Datasets describing hydrogel properties and cellular metrics for modeling of tumor dormancy. Data in brief 25, 104128, doi: 10.1016/j.dib.2019.104128 (2019). [DOI] [PMC free article] [PubMed] [Google Scholar]
- [14].Pradhan S & Slater JH Tunable hydrogels for controlling phenotypic cancer cell states to model breast cancer dormancy and reactivation. Biomaterials 215, 119177, doi: 10.1016/j.biomaterials.2019.04.022 (2019). [DOI] [PMC free article] [PubMed] [Google Scholar]
- [15].Pradhan S & Slater JH Fabrication, characterization, and implementation of engineered hydrogels for controlling breast cancer cell phenotype and dormancy. MethodsX 6, 2744–2766, doi: 10.1016/j.mex.2019.11.011 (2019). [DOI] [PMC free article] [PubMed] [Google Scholar]
- [16].Farino Reyes CJ, Pradhan S, Slater JH The Influence of Ligand Density and Degradability on Hydrogel Induced Breast Cancer Dormancy and Reactivation. Advanced Healthcare Materials (2021). [DOI] [PMC free article] [PubMed]
- [17].Kim RS et al. Dormancy signatures and metastasis in estrogen receptor positive and negative breast cancer. PLoS One 7, e35569, doi: 10.1371/journal.pone.0035569 (2012). [DOI] [PMC free article] [PubMed] [Google Scholar]
- [18].Zhang XH, Giuliano M, Trivedi MV, Schiff R & Osborne CK Metastasis dormancy in estrogen receptor-positive breast cancer. Clinical cancer research : an official journal of the American Association for Cancer Research 19, 6389–6397, doi: 10.1158/1078-0432.Ccr-13-0838 (2013). [DOI] [PMC free article] [PubMed] [Google Scholar]
- [19].Ghajar CM, Peinado H, Mori H, Matei IR, Evason KJ, Brazier H, Almeida D, Koller A, Hajjar KA, Stainier DY, Chen EI, Lyden D, Bissell MJ The perivascular niche regulates breast tumour dormancy. Nat Cell Biol 15, 807–817, doi: 10.1038/ncb2767 (2013). [DOI] [PMC free article] [PubMed] [Google Scholar]
- [20].Walker C, Mojares E & Del Río Hernández A Role of Extracellular Matrix in Development and Cancer Progression. Int J Mol Sci 19, doi: 10.3390/ijms19103028 (2018). [DOI] [PMC free article] [PubMed] [Google Scholar]
- [21].Özkan A et al. Tumor Microenvironment Alters Chemoresistance of Hepatocellular Carcinoma Through CYP3A4 Metabolic Activity. Frontiers in oncology 11, 662135, doi: 10.3389/fonc.2021.662135 (2021). [DOI] [PMC free article] [PubMed] [Google Scholar]
- [22].Zuniga K et al. Collagen/kerateine multi-protein hydrogels as a thermally stable extracellular matrix for 3D in vitro models. Int J Hyperthermia 38, 830–845, doi: 10.1080/02656736.2021.1930202 (2021). [DOI] [PMC free article] [PubMed] [Google Scholar]
- [23].Khoo AS et al. Breast Cancer Cells Transition from Mesenchymal to Amoeboid Migration in Tunable Three-Dimensional Silk-Collagen Hydrogels. ACS Biomater Sci Eng 5, 4341–4354, doi: 10.1021/acsbiomaterials.9b00519 (2019). [DOI] [PMC free article] [PubMed] [Google Scholar]
- [24].Molley TG et al. Heterotypic tumor models through freeform printing into photostabilized granular microgels. Biomater Sci 9, 4496–4509, doi: 10.1039/d1bm00574j (2021). [DOI] [PMC free article] [PubMed] [Google Scholar]
- [25].Lee J, Abdeen A, Goonetilleke S, Kilian K Gradient and Dynamic Hydrogel Materials to Probe Dynamics in Cancer Stem Cell Phenotypes. ACS Appl Bio Mater 4, 711–720 (2021). [Google Scholar]
- [26].Molley TG et al. Geometrically Structured Microtumors in 3D Hydrogel Matrices. Adv Biosyst 4, e2000056, doi: 10.1002/adbi.202000056 (2020). [DOI] [PubMed] [Google Scholar]
- [27].Yu Q et al. Extracellular Matrix Proteins Confer Cell Adhesion-Mediated Drug Resistance Through Integrin α (v) in Glioblastoma Cells. Front Cell Dev Biol 9, 616580, doi: 10.3389/fcell.2021.616580 (2021). [DOI] [PMC free article] [PubMed] [Google Scholar]
- [28].Xiao W et al. Bioengineered scaffolds for 3D culture demonstrate extracellular matrix-mediated mechanisms of chemotherapy resistance in glioblastoma. Matrix Biol 85–86, 128–146, doi: 10.1016/j.matbio.2019.04.003 (2020). [DOI] [PMC free article] [PubMed] [Google Scholar]
- [29].Xiao W et al. Brain-Mimetic 3D Culture Platforms Allow Investigation of Cooperative Effects of Extracellular Matrix Features on Therapeutic Resistance in Glioblastoma. Cancer research 78, 1358–1370, doi: 10.1158/0008-5472.Can-17-2429 (2018). [DOI] [PMC free article] [PubMed] [Google Scholar]
- [30].Gill BJ et al. A synthetic matrix with independently tunable biochemistry and mechanical properties to study epithelial morphogenesis and EMT in a lung adenocarcinoma model. Cancer research 72, 6013–6023, doi: 10.1158/0008-5472.Can-12-0895 (2012). [DOI] [PMC free article] [PubMed] [Google Scholar]
- [31].Schweller RM & West JL Encoding Hydrogel Mechanics via Network Cross-Linking Structure. ACS Biomater Sci Eng 1, 335–344, doi: 10.1021/acsbiomaterials.5b00064 (2015). [DOI] [PMC free article] [PubMed] [Google Scholar]
- [32].Schweller RM, Wu ZJ, Klitzman B & West JL Stiffness of Protease Sensitive and Cell Adhesive PEG Hydrogels Promotes Neovascularization In Vivo. Ann Biomed Eng 45, 1387–1398, doi: 10.1007/s10439-017-1822-8 (2017). [DOI] [PMC free article] [PubMed] [Google Scholar]
- [33].Montagner M & Sahai E In vitro Models of Breast Cancer Metastatic Dormancy. Front Cell Dev Biol 8, 37, doi: 10.3389/fcell.2020.00037 (2020). [DOI] [PMC free article] [PubMed] [Google Scholar]
- [34].Dev R et al. Hypermetabolism and symptom burden in advanced cancer patients evaluated in a cachexia clinic. J Cachexia Sarcopenia Muscle 6, 95–98, doi: 10.1002/jcsm.12014 (2015). [DOI] [PMC free article] [PubMed] [Google Scholar]
- [35].Sjögren M et al. Hypermetabolism in mice caused by the central action of an unliganded thyroid hormone receptor alpha1. Embo j 26, 4535–4545, doi: 10.1038/sj.emboj.7601882 (2007). [DOI] [PMC free article] [PubMed] [Google Scholar]
- [36].AbuHammad S & Zihlif M Gene expression alterations in doxorubicin resistant MCF7 breast cancer cell line. Genomics 101, 213–220, doi: 10.1016/j.ygeno.2012.11.009 (2013). [DOI] [PubMed] [Google Scholar]
- [37].Taylor CW et al. Different mechanisms of decreased drug accumulation in doxorubicin and mitoxantrone resistant variants of the MCF7 human breast cancer cell line. Br J Cancer 63, 923–929, doi: 10.1038/bjc.1991.202 (1991). [DOI] [PMC free article] [PubMed] [Google Scholar]
- [38].Pritchard JE, Dillon PM, Conaway MR, Silva CM & Parsons SJ A mechanistic study of the effect of doxorubicin/adriamycin on the estrogen response in a breast cancer model. Oncology 83, 305–320, doi: 10.1159/000341394 (2012). [DOI] [PMC free article] [PubMed] [Google Scholar]
- [39].Farino CJ, Pradhan S & Slater JH The Influence of Matrix-Induced Dormancy on Metastatic Breast Cancer Chemoresistance. ACS Applied Bio Materials 3, 5832–5844, doi: 10.1021/acsabm.0c00549 (2020). [DOI] [PMC free article] [PubMed] [Google Scholar]
- [40].Aguirre-Ghiso JA, Estrada Y, Liu D & Ossowski L ERK(MAPK) activity as a determinant of tumor growth and dormancy; regulation by p38(SAPK). Cancer research 63, 1684–1695 (2003). [PubMed] [Google Scholar]
- [41].Aguirre-Ghiso JA, Liu D, Mignatti A, Kovalski K & Ossowski L Urokinase receptor and fibronectin regulate the ERK(MAPK) to p38(MAPK) activity ratios that determine carcinoma cell proliferation or dormancy in vivo. Mol Biol Cell 12, 863–879, doi: 10.1091/mbc.12.4.863 (2001). [DOI] [PMC free article] [PubMed] [Google Scholar]
- [42].Park SY & Nam JS The force awakens: metastatic dormant cancer cells. Exp Mol Med 52, 569–581, doi: 10.1038/s12276-020-0423-z (2020). [DOI] [PMC free article] [PubMed] [Google Scholar]
- [43].Janni W, Vogl FD, Wiedswang G, Synnestvedt M, Fehm T, Juckstock J, Borgen E, Rack B, Braun S, Sommer H, Solomayer E, Pantel K, Nesland J, Friese K, Naume B Persistence of disseminated tumor cells in the bone marrow of breast cancer patients predicts increased risk for relapse--a European pooled analysis. Clinical cancer research : an official journal of the American Association for Cancer Research 17, 2967–2976, doi: 10.1158/1078-0432.Ccr-10-2515 (2011). [DOI] [PubMed] [Google Scholar]
- [44].Senft D & Ronai ZA Adaptive Stress Responses During Tumor Metastasis and Dormancy. Trends in cancer 2, 429–442, doi: 10.1016/j.trecan.2016.06.004 (2016). [DOI] [PubMed] [Google Scholar]
- [45].Keeratichamroen S, Lirdprapamongkol K & Svasti J Mechanism of ECM-induced dormancy and chemoresistance in A549 human lung carcinoma cells. Oncology reports 39, 1765–1774, doi: 10.3892/or.2018.6258 (2018). [DOI] [PubMed] [Google Scholar]
- [46].Ovadia EM et al. Understanding ER+ Breast Cancer Dormancy Using Bioinspired Synthetic Matrices for Long-Term 3D Culture and Insights into Late Recurrence. Adv Biosyst 4, e2000119, doi: 10.1002/adbi.202000119 (2020). [DOI] [PMC free article] [PubMed] [Google Scholar]
- [47].Narkhede AA, Crenshaw JH, Crossman DK, Shevde LA & Rao SS An in vitro hyaluronic acid hydrogel based platform to model dormancy in brain metastatic breast cancer cells. Acta Biomater 107, 65–77, doi: 10.1016/j.actbio.2020.02.039 (2020). [DOI] [PubMed] [Google Scholar]
- [48].Kondapaneni RV & Rao SS Matrix stiffness and cluster size collectively regulate dormancy versus proliferation in brain metastatic breast cancer cell clusters. Biomater Sci, doi: 10.1039/d0bm00969e (2020). [DOI] [PubMed]
- [49].Park KM, Lewis D & Gerecht S Bioinspired Hydrogels to Engineer Cancer Microenvironments. Annu Rev Biomed Eng 19, 109–133, doi: 10.1146/annurev-bioeng-071516-044619 (2017). [DOI] [PMC free article] [PubMed] [Google Scholar]
- [50].Blanco-Fernandez B, Gaspar VM, Engel E & Mano JF Proteinaceous Hydrogels for Bioengineering Advanced 3D Tumor Models. Adv Sci (Weinh) 8, 2003129, doi: 10.1002/advs.202003129 (2021). [DOI] [PMC free article] [PubMed] [Google Scholar]
- [51].Fernando K, Kwang LG, Lim JTC & Fong ELS Hydrogels to engineer tumor microenvironments in vitro. Biomater Sci 9, 2362–2383, doi: 10.1039/d0bm01943g (2021). [DOI] [PubMed] [Google Scholar]
- [52].Comşa Ş, Cîmpean AM & Raica M The Story of MCF-7 Breast Cancer Cell Line: 40 years of Experience in Research. Anticancer research 35, 3147–3154 (2015). [PubMed] [Google Scholar]
- [53].Luzzi KJ, MacDonald IC, Schmidt EE, Kerkvliet N, Morris VL, Chambers AF, Groom AC Multistep nature of metastatic inefficiency: dormancy of solitary cells after successful extravasation and limited survival of early micrometastases. Am J Pathol 153, 865–873, doi: 10.1016/s0002-9440(10)65628-3 (1998). [DOI] [PMC free article] [PubMed] [Google Scholar]
- [54].Faubert B, Solmonson A & DeBerardinis RJ Metabolic reprogramming and cancer progression. Science (New York, N.Y.) 368, doi: 10.1126/science.aaw5473 (2020). [DOI] [PMC free article] [PubMed] [Google Scholar]
- [55].Chen C et al. TSC-mTOR maintains quiescence and function of hematopoietic stem cells by repressing mitochondrial biogenesis and reactive oxygen species. J Exp Med 205, 2397–2408, doi: 10.1084/jem.20081297 (2008). [DOI] [PMC free article] [PubMed] [Google Scholar]
- [56].Bahadoran A, Bezavada L & Smallwood HS Fueling influenza and the immune response: Implications for metabolic reprogramming during influenza infection and immunometabolism. Immunol Rev 295, 140–166, doi: 10.1111/imr.12851 (2020). [DOI] [PubMed] [Google Scholar]
- [57].Aguirre-Ghiso JA How dormant cancer persists and reawakens. Science (New York, N.Y.) 361, 1314–1315, doi: 10.1126/science.aav0191 (2018). [DOI] [PMC free article] [PubMed] [Google Scholar]
- [58].Liu YL et al. Assessing metastatic potential of breast cancer cells based on EGFR dynamics. Sci Rep 9, 3395, doi: 10.1038/s41598-018-37625-0 (2019). [DOI] [PMC free article] [PubMed] [Google Scholar]
- [59].Gordon LA et al. Breast cell invasive potential relates to the myoepithelial phenotype. International journal of cancer 106, 8–16, doi: 10.1002/ijc.11172 (2003). [DOI] [PubMed] [Google Scholar]
Associated Data
This section collects any data citations, data availability statements, or supplementary materials included in this article.