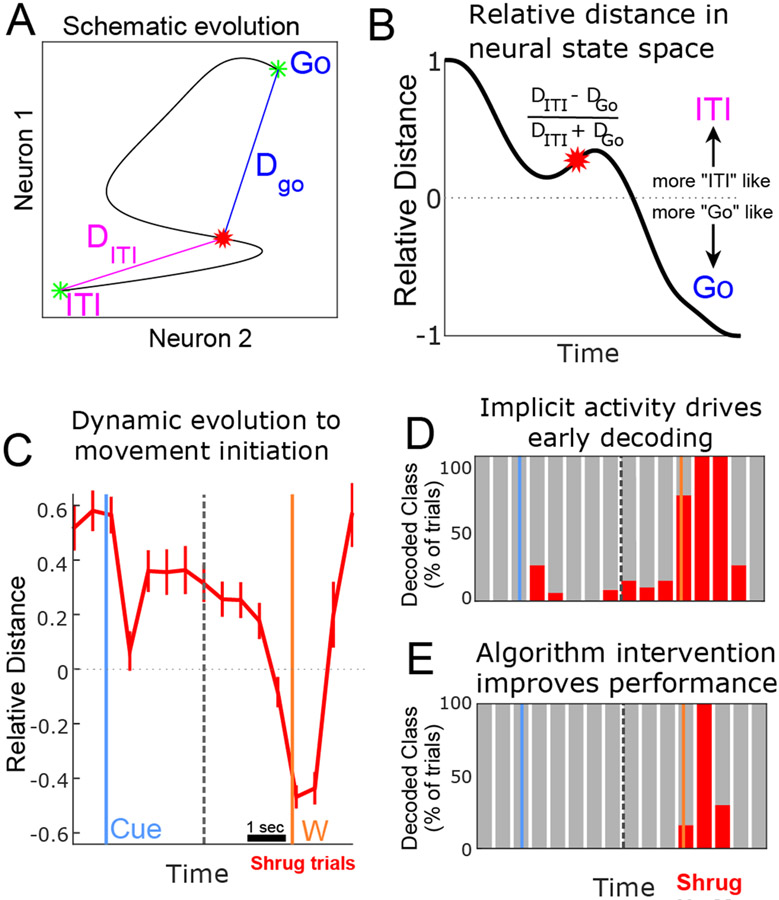
Figure 4: Early network dynamics can explain the “pre-conscious” triggering of the neural decoder.
A) Schematic. Through the course of a trial neural activity transitions from resting levels (ITI) to the response measured during execution (GO) (thin black-line). This activity can be quantified by the geometric distance to the ITI and Go activity patterns (DGO, DITI). B) Schematic. DGO and DITI can be used to calculate a continuous measure of similarity to ITI and Go. C) Distance analysis applied to actual data for shrug (red) and squeeze (green) trials (mean ± 95% CI). The dashed line represents temporal discontinuity from concatenating cue-aligned and movement-aligned signals. D) Decode analysis using LDA applied to the same data as C. Each column shows the percentage of trials each class was decoded for a single time bin (500 ms non-overlapping bins.) Populations dynamics observed in C are sufficient to generate early decodes of shrug actions (e.g., following cue & before reported urge). E) Decode analysis using a modified algorithm and training protocol applied to the same data as D can restrict decoding actions to the time of intended execution. See also Figure S4, Video S3.

