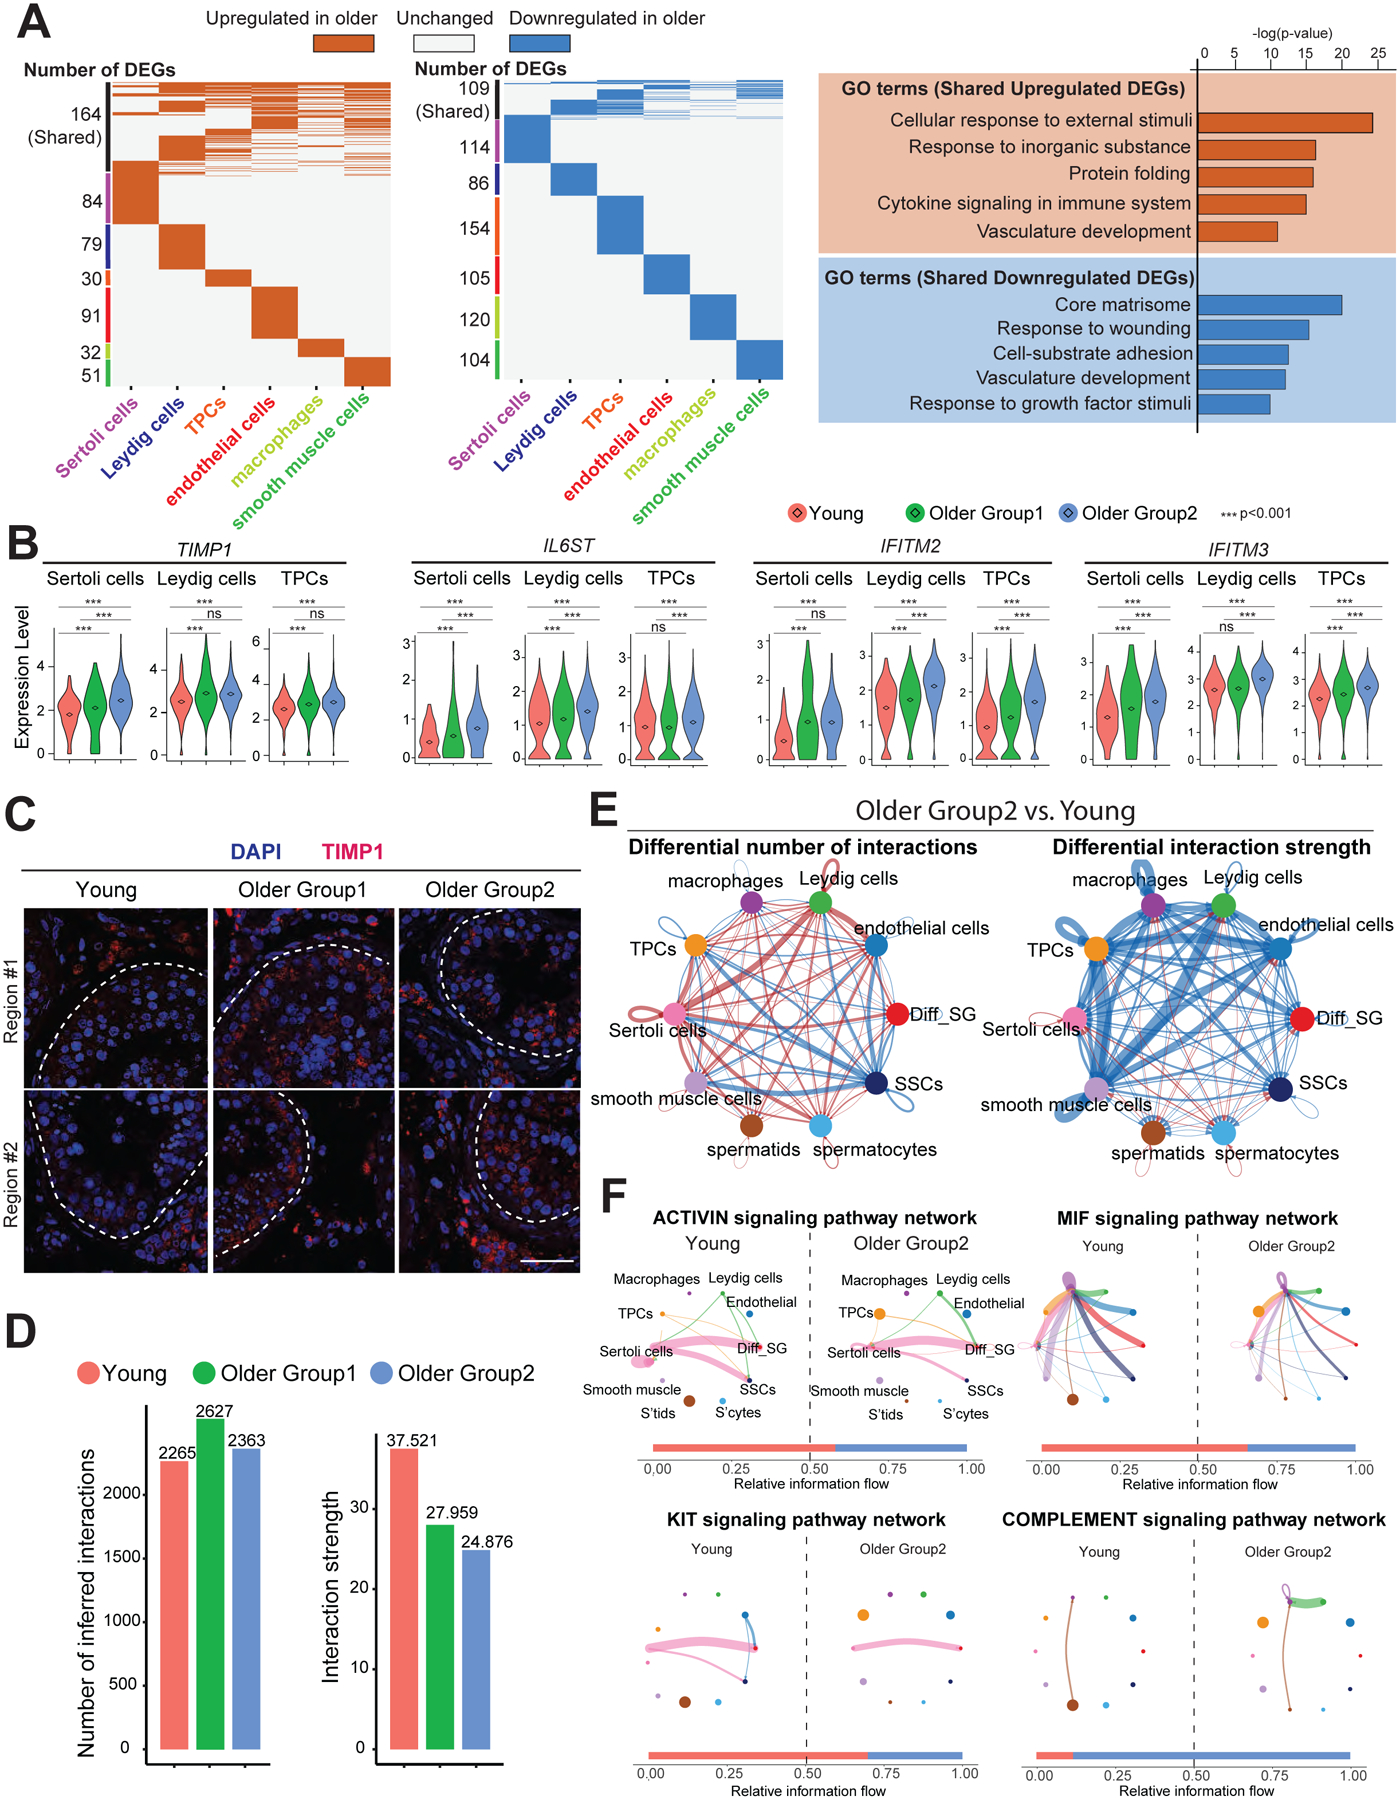
Figure 3. Global alterations of the testicular somatic cells and somatic-germline interactions in older human testis.

(A) Left: Heatmap showing common and unique upregulated DEGs between young and older men in each major testicular somatic cell type. Middle: Heatmap showing common and unique downregulated DEGs between young and older men in each major testicular somatic cell type. Right: Representative GO terms of shared upregulated (top) or downregulated (bottom) DEGs between young and older somatic cells and their associated p-value.
(B) Violin plots showing upregulated DEGs of older testicular somatic cells related to inflammation. Diamond inside the violin represents the mean.
(C) Immunofluorescence images of TIMP1 (red) show the elevated TIMP1 staining signal in older testis. Nuclei were counterstained with DAPI (blue). Dashed lines indicate seminiferous tubule membranes. Two donors from each group are shown. Scale bar, 50 μm.
(D) Bar plots showing the number of inferred interactions (left) or interaction strength (right) in the cell-cell communication network analyzed by CellChat across the three groups.
(E) Circle plots (by CellChat analysis) depict the differential number of interactions (left) or interaction strength (right) in the cell-cell communication network between Young and Older Group2, respectively, indicating SSCs lose interactions with testicular somatic cells during aging. Red or blue edges represent increased or decreased signaling in Older Group2 compared to Young, respectively.
(F) Circle plots showing selected inferred differential signaling networks. The edge width represents the communication probability. Bar graph at the bottom of each panel illustrates representative information flow in Older Group2 (blue) and Young (red).
See also Figure S2.
