
Figure 4. Sertoli cells from older men display metabolic dysregulation.
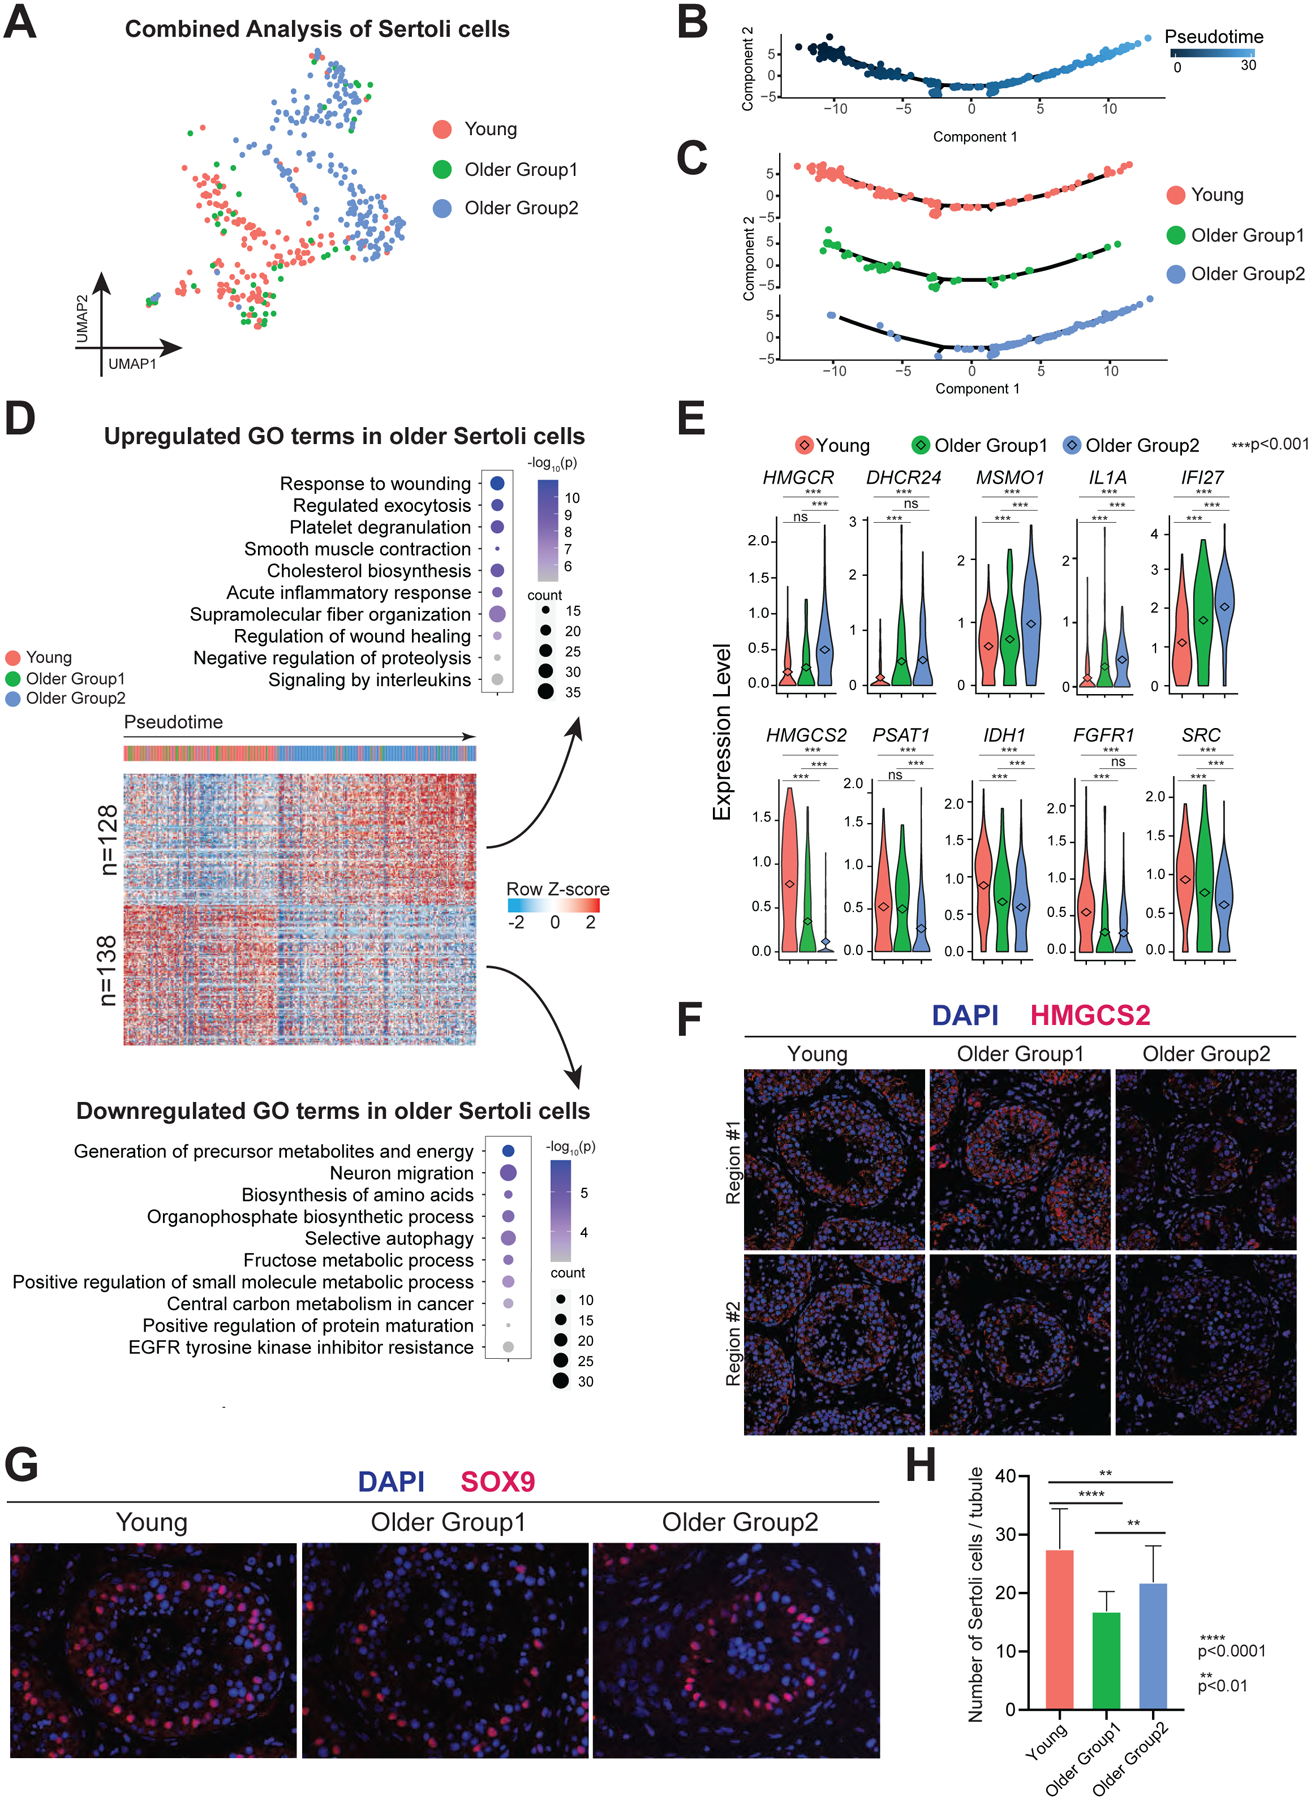
(A) UMAP plot showing focused analysis of Sertoli cells from Fig 1C.
(B) Pseudotime trajectory of Sertoli cells analyzed by Monocle.
(C) Deconvolution of pseudotime trajectory of Fig 4B according to Young/Older Groups, predicting gradual change from Young through Older Group1 to Older Group2.
(D) Heatmap showing both upregulated and downregulated DEGs in Older Groups of Sertoli cells with columns/cells placed in pseudotime order defined in Figure 4C. The scaled gene expression levels are colored according to Z-score. The top 10 upregulated or downregulated GO terms enriched in the DEGs are listed with p-value and gene numbers.
(E) Violin plots showing upregulated DEGs of older Sertoli cells on the top panel and downregulated DEGs of older Sertoli cells at the bottom panel. The diamond inside the violin plot represents the mean.
(F) Immunofluorescence images of HMGCS2 (red) in different groups show a significant decrease in staining signal in Older Group2 testis. Nuclei were counterstained with DAPI (blue). Two donors from each group are shown. Scale bar, 50 μm.
(G) Immunofluorescence images of a Sertoli cell marker, SOX9 (red) in different groups (Young, Older Group1, and Older Group2). Nuclei were counterstained with DAPI (blue). Scale bar, 50 μm.
(H) Quantification of the number of Sertoli cells (SOX9 positive) in cross-section of each seminiferous tubule in different groups. Bars represent the mean with SD of 20 independent tubules per group. n = 6 human samples. ****p < 0.0001, **p < 0.01 (two-tailed t-test).
See also Figure S3.