
Figure 5. Leydig cells from older men display declined functionality, including lower production of testosterone.
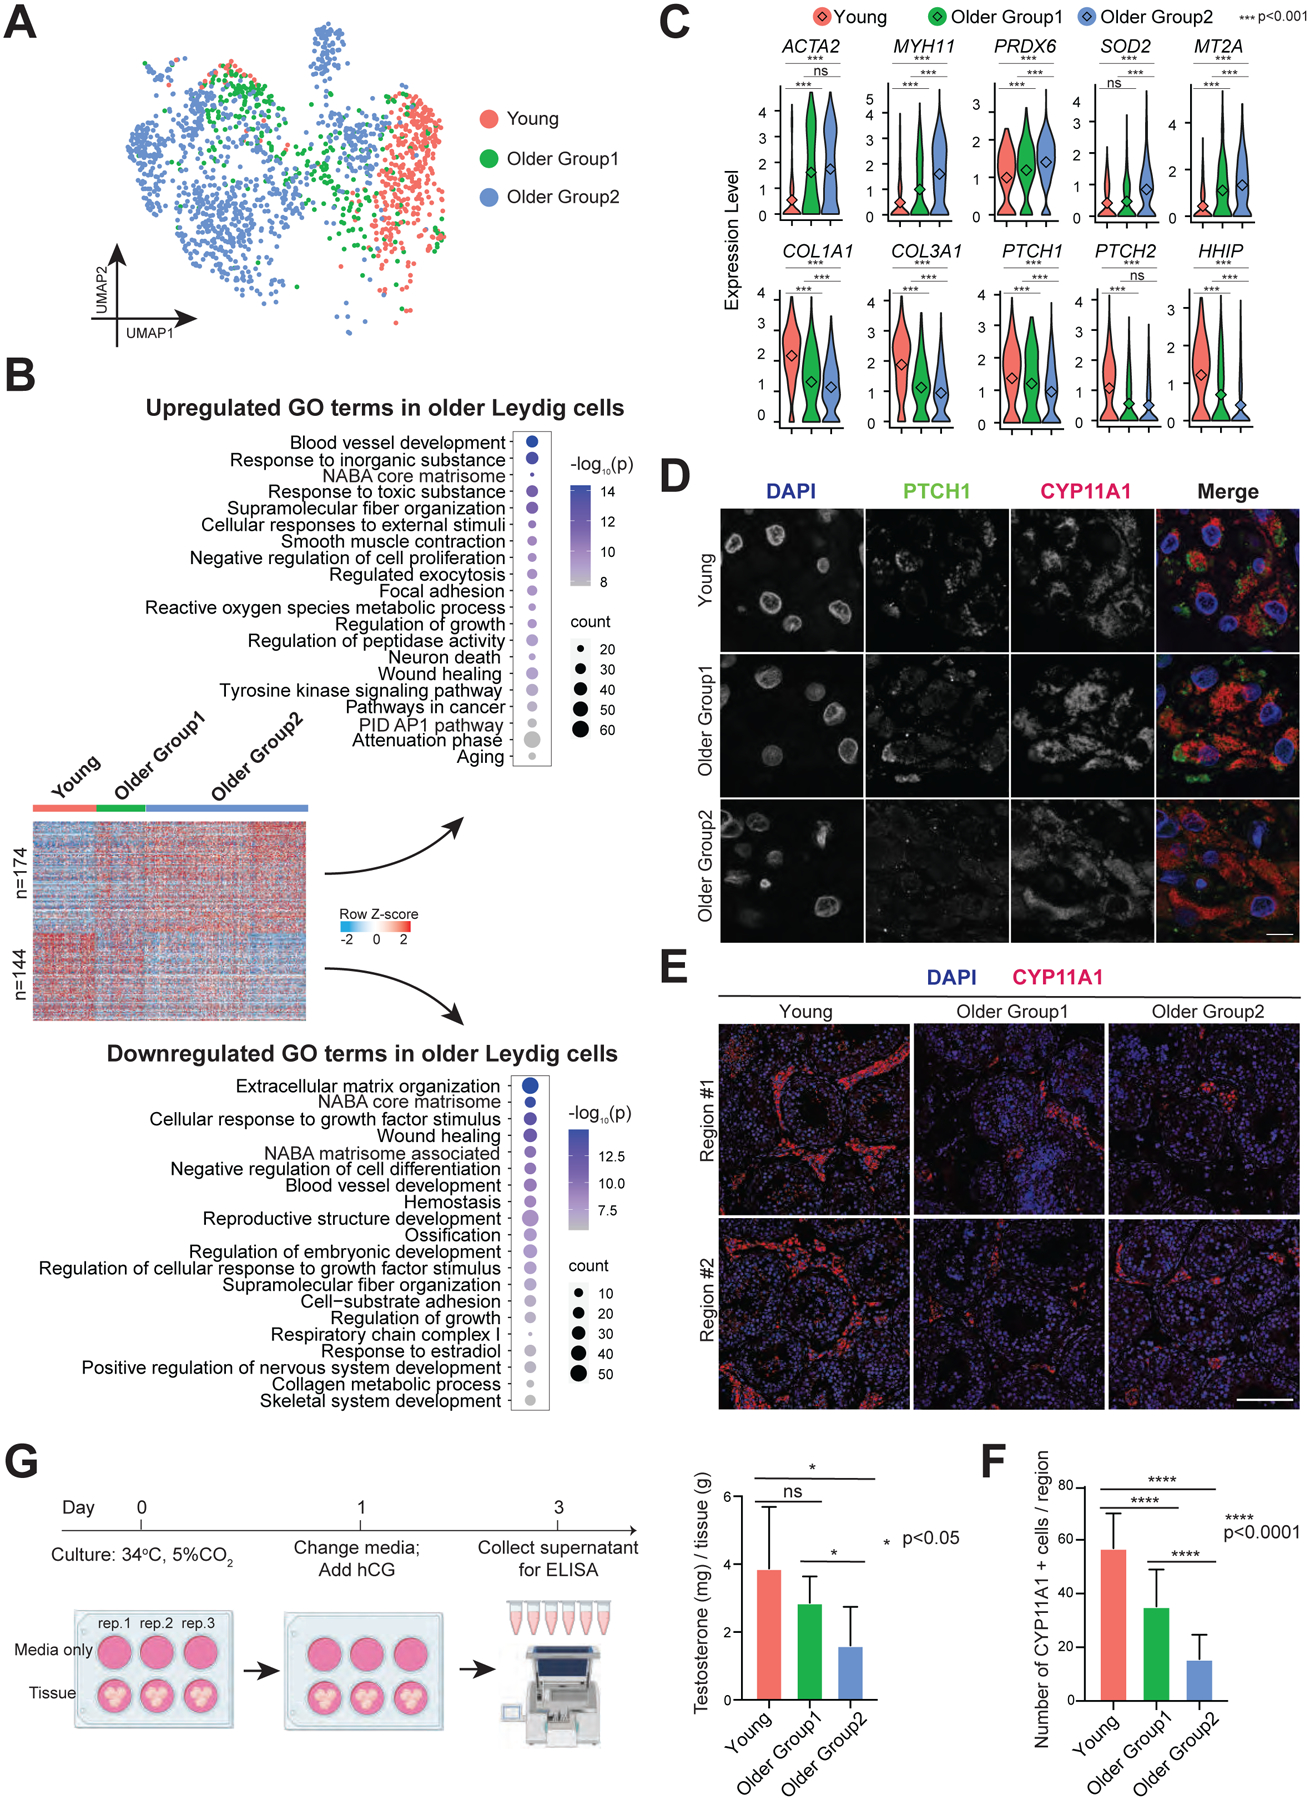
(A) UMAP plot showing focused analysis of Leydig cells from Fig 1C.
(B) Heatmaps showing both upregulated and downregulated DEGs in older Leydig cells. The scaled gene expression levels are colored according to Z-score. The top 20 upregulated or downregulated GO terms enriched in the DEGs are listed with p-value and gene numbers.
(C) Violin plots showing upregulated DEGs of older Leydig cells within the top panel and downregulated DEGs of older Leydig cells within the bottom panel. The diamond inside the violin plot represents the mean.
(D) Immunofluorescence images of PTCH1 (green) with a Leydig cell marker, CYP11A1 (red) in different groups, revealing decreased PTCH1 expression in older Leydig cells. Nuclei were counterstained with DAPI (blue). Two donors from each group are shown. Scale bar, 10 μm.
(E) Immunofluorescence images of a Leydig cell marker, CYP11A1 (red) in different groups. Nuclei were counterstained with DAPI (blue). Two donors from each group are shown. Scale bar, 50 μm.
(F) Quantification of the number of Leydig cells (CYP11A1 positive) in cross-section of each microscopic field (0.04 mm2) in different groups, demonstrating reduced Leydig cells during aging. Bars represent the mean with SD of 20 independent tubules per group. n = 6 human samples. ****p < 0.0001 (two-tailed t-test).
(G) Left: Schematic of tissue explant culture used to test testosterone production of older Leydig cells. Right: Quantification of testosterone production in Young, Older Group1, and Older Group2, indicating older testis produce less testosterone. Bars represent the mean with SD of 9 donors with 3 technical replicates per sample. *p < 0.05, ns: no significance (two-tailed t-test).
See also Figure S4.