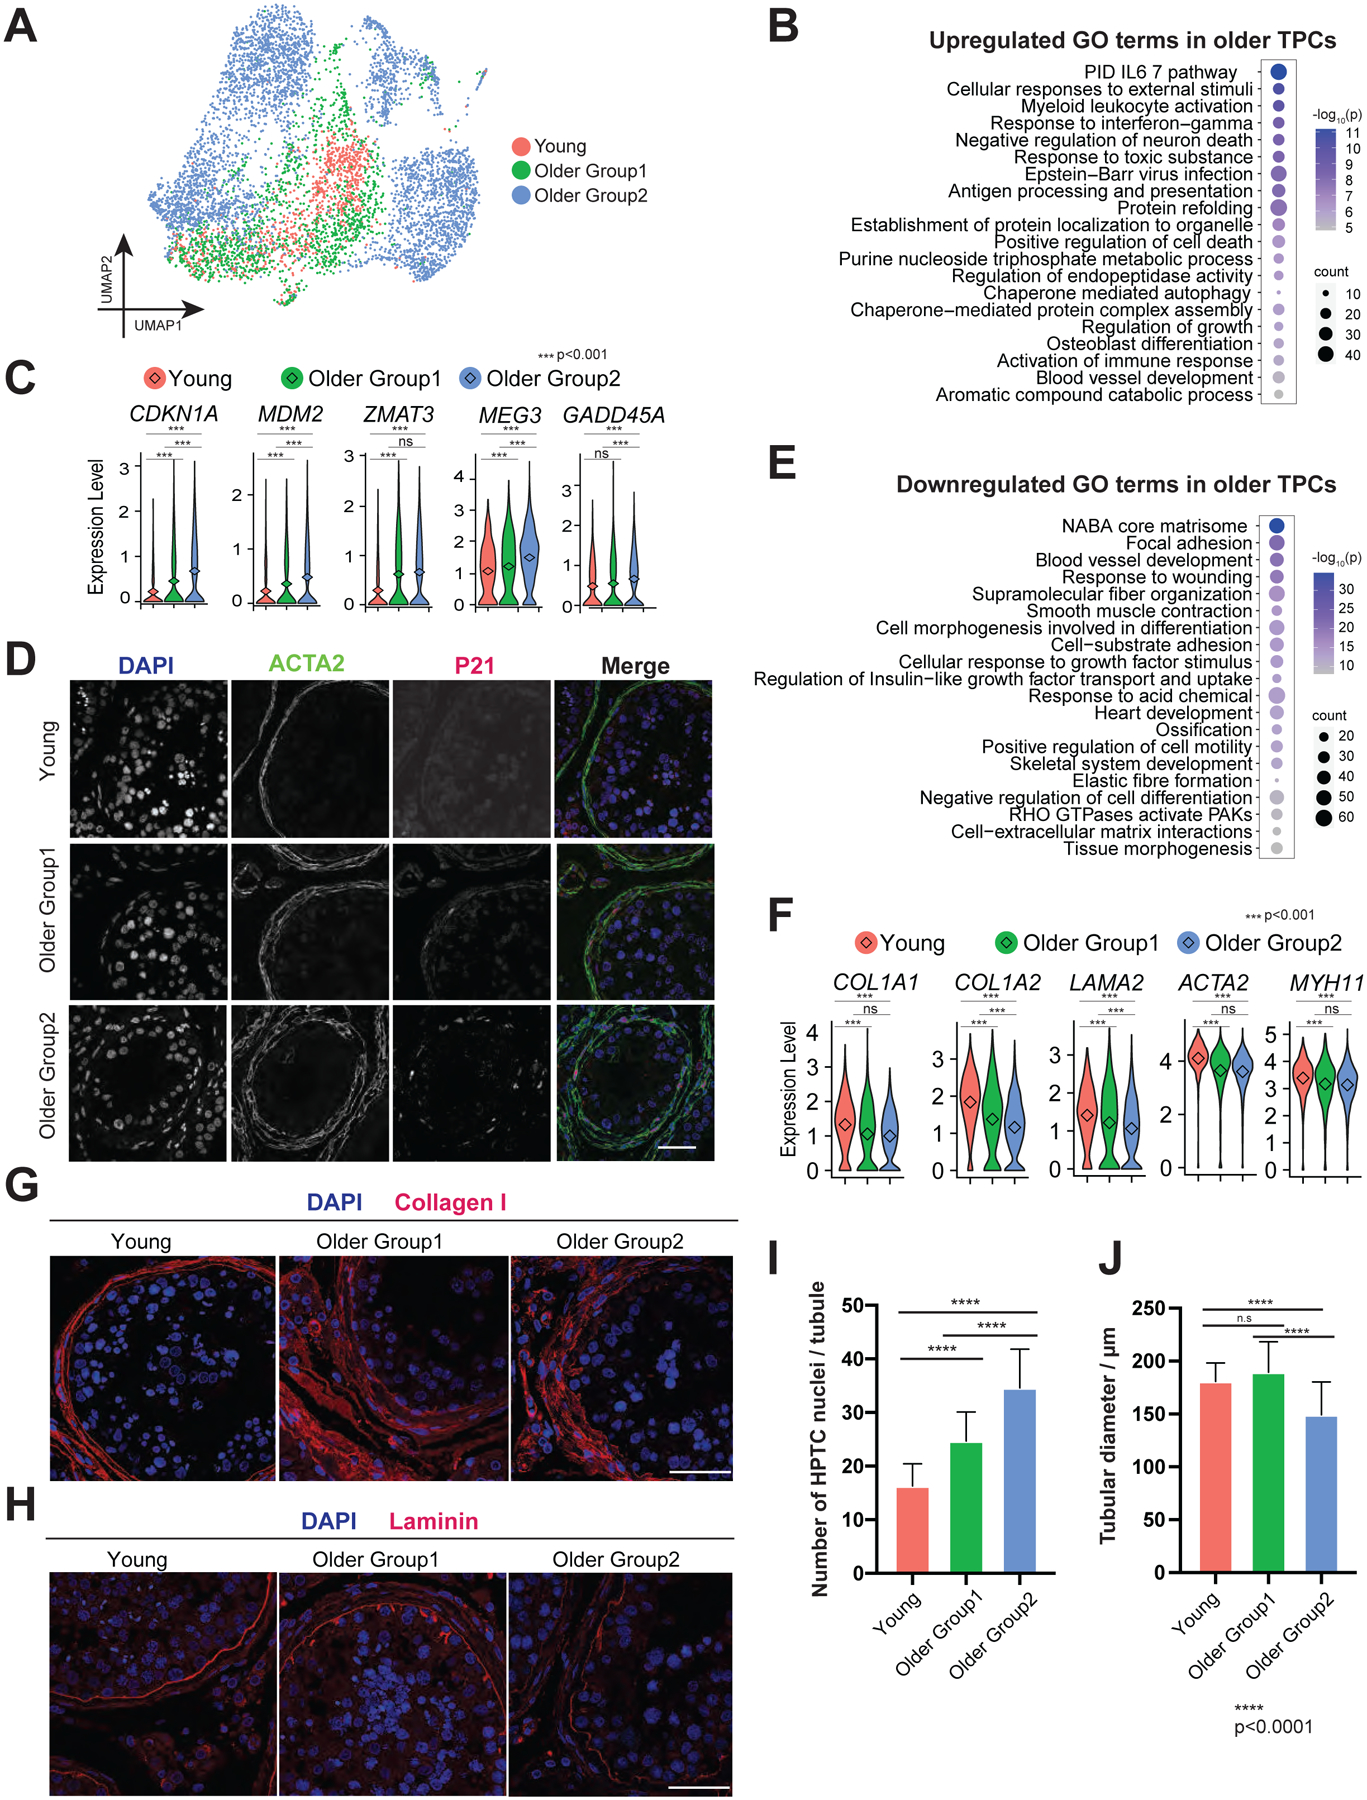
Figure 6. TPCs display morphological and functional alternations in older testes.

(A) UMAP plot showing focused analysis of TPCs from Fig 1C.
(B) Dot plot showing the top 20 upregulated GO terms enriched in the DEGs of older TPCs with p-value and gene numbers.
(C) Violin plots with mean expression level highlighted inside showing upregulated DEGs of older TPCs.
(D) Immunofluorescence images of p21 (encoded by CDKN1A, red) with a TPC marker, ACTA2 (green) in different groups, revealing increased p21 expression in older TPC cells. Nuclei were counterstained with DAPI (blue). Arrows indicate p21 positive cells. n = 6 human samples. Scale bar, 50 μm.
(E) Dot plot showing the top 20 downregulated GO terms in older TPCs with p-value and gene numbers.
(F) Violin plots showing downregulated DEGs of older TPCs. The diamond inside the violin plot represents the mean.
(G) Immunofluorescence images of Collagen I (red), revealing increased Collagen I deposition in older PTC cells. n = 6 human samples. Scale bar, 50 μm.
(H) Immunofluorescence images of Laminin (red), revealing abnormal laminin deposition in older PTC cells. n = 6 human samples. Scale bar, 50 μm.
(I) Quantification of the number of TPCs in cross-section of each seminiferous tubule in different groups, revealing a progressive increase in the numbers of TPCs around the walls of seminiferous tubules from Young through Older Group1 to Older Group2. Bars represent the mean with SD of 20 independent tubules per group. n = 6 human samples. ****p < 0.0001, **p < 0.01 (two-tailed t-test).
(J) Quantification of the diameter of seminiferous tubules in different groups. Bars represent the mean with SD of 20 independent tubules per group. n = 6 human samples. ****p < 0.0001, **p < 0.01 (two-tailed t-test).
