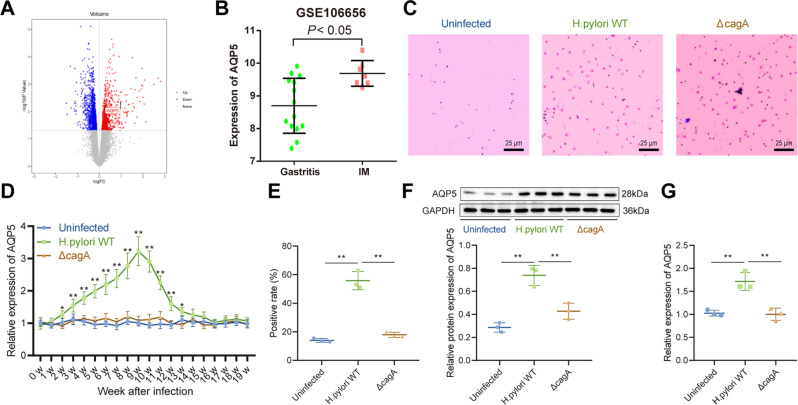
Fig. 1. H. pylori infection elevates AQP5 expression in gastric mucosa.
A Volcano map of differentially expressed genes in microarray data GSE106656. Red represents upregulated genes and green represents downregulated genes with |log2FC | ≥ 1 and p < 0.05. B, AQP5 expression in 14 gastritis patients and 7 IM patients in microarray data GSE106656. C, H. pylori infection in mice detected by Giemsa staining. D, AQP5 mRNA level in mouse gastric mucosa determined by RT-qPCR (n = 6). E, AQP5 protein level in mouse gastric mucosa determined by immunohistochemistry (n = 3). F, AQP5 protein level in mouse isolated gastric mucosa determined by Western blot analysis (n = 3). G, AQP5 mRNA level in mouse isolated gastric mucosa determined by RT-qPCR (n = 3). *p < 0.05, **p < 0.01. Data were shown as the mean ± standard deviation. Comparisons of data between two groups were analyzed by independent sample t-test. One-way ANOVA was applied for the comparison of data among multiple groups. The data between groups at different time points were compared by repeated measures ANOVA.

