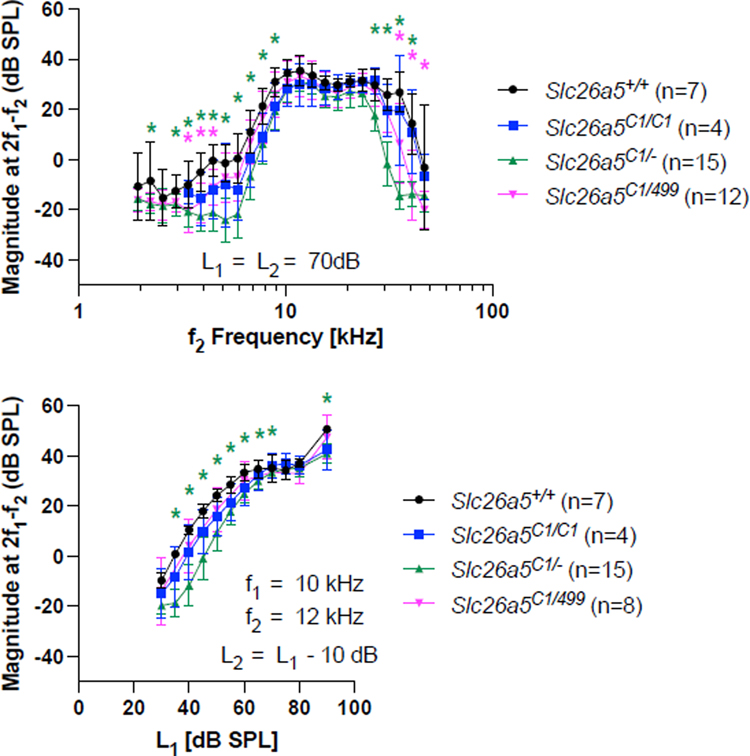
Fig. 4. DPOAEs in Slc26a5C1/C1, Slc26a5C1/−, and Slc26a5C1/499 mice.
Iso-input functions collected at 70 dB SPL are provided in the top panel, input-output functions at f2 = 12 kHz in the bottom panel. In both panels, data are provided for Slc26a5C1/C1 homozygotes (blue), Slc26a5C1/− heterozygotes (green), Slc26a5C1/499 compound heterozygotes (magenta), and controls (black). The results are provided as means and standard deviations. Asterisks indicate statistically significant difference, p < 0.05, compared to WT controls (determined by one-way ANOVA followed by the Dunnett’s Multiple Comparison Procedure). In the upper panel, the ages of mice (postnatal days) were: 18, 18, 18, 19, 19, 20, and 21 for Slc26a5+/+; 19, 19, 19, and 104 for Slc26a5C1/C1; 20, 20, 20, 20, 20, 21, 21, 21, 22, 22, 22, 22, 22, 29, and 29 for Slc26a5C1/−; 23, 25, 25, 26, 27, 28, 29, 30, 31, 34, 35 and 47 for Slc26a5C1/499. In the bottom panel, the ages of mice (postnatal days) were: 18, 18, 19, 19, 20, 23, and 31 for Slc26a5+/+; 19, 19, 19, and 104 for Slc26a5C1/C1; 20, 20, 20, 20, 21, 21, 21, 21, 22, 22, 22, 22, 22, 29, and 29 for Slc26a5C1/−; 25, 28, 29, 30, 30, 32, 32, and 36 for Slc26a5C1/499.

