
Figure 2.
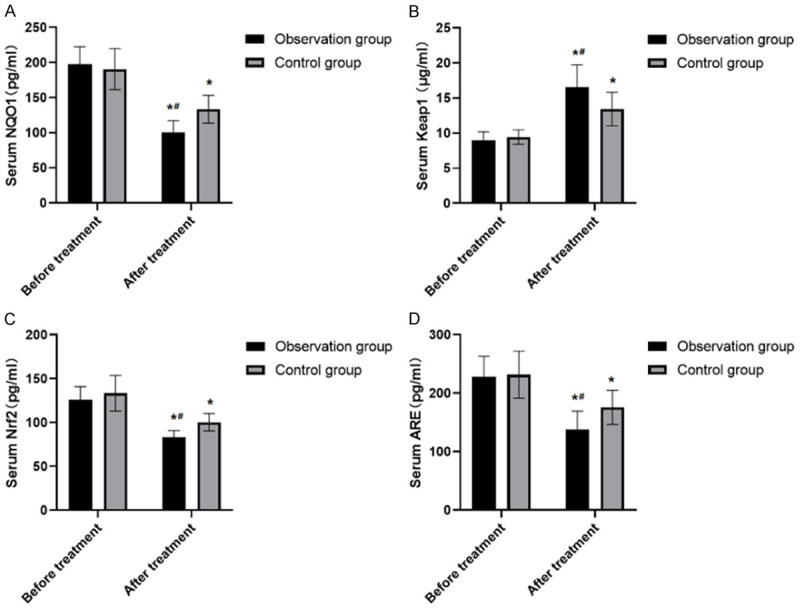
Expression of serum levels of Keap1-Nrf2/ARE signal pathway related molecules between two groups before and after treatment. A. There were no significant differences in the levels of NQO1 between the two groups before treatment (P>0.05). The the levels of NQO1 were significantly lower than those before treatment (P<0.05). The NQO1 were markedly lower than those of the control group (P<0.05). B. There were no significant differences in the levels of Keap1 between the two groups before treatment (P>0.05). The levels of Keap1 after treatment were significantly higher than those before treatment (P<0.05). The Keap1 of the observation group after treatment was significantly higher than that of the control group (P<0.05). C. There were no significant differences in the levels of Nrf2 between the two groups before treatment (P>0.05). The the levels of Nrf2 were significantly lower than those before treatment (P<0.05). The Nrf2 were markedly lower than those of the control group (P<0.05). D. There were no significant differences in the levels of ARE between the two groups before treatment (P>0.05). The the levels of ARE were significantly lower than those before treatment (P<0.05). The ARE were markedly lower than those of the control group (P<0.05). Note: The comparison of the same group before and after treatment was performed by paired t test, *P<0.05; The comparison with the same group of treatment was by t-test, #P<0.05.