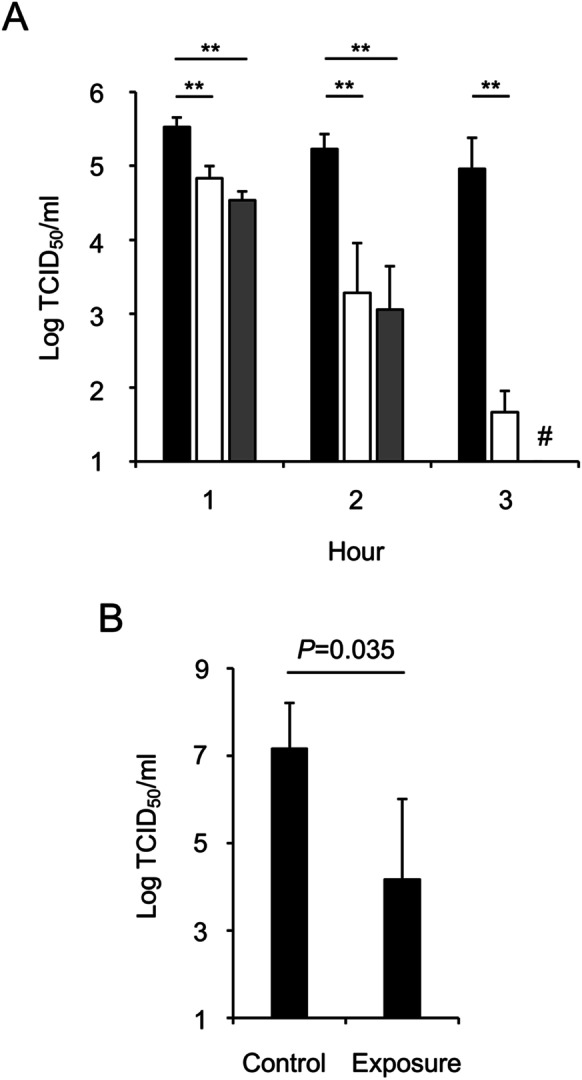
Fig. 3.

Inactivation of SARS-CoV-2 by NEAWPs. (A) Viruses suspended in DMEM supplemented with FBS and G418 were exposed to NEAWPs from the original device (white) or from the modified device (generating NEAWPs containing 100-fold amounts of ROS compared with the original device) (gray) for 1 to 3 h. And then they were titrated by TCID50 and compared with samples after exposure to control conditions (a fan only) (black). (B) After viruses in PBS were exposed to NEAWPs for 1 h, viral titers (TCID50) were measured and compared with the control. All data represent the means + SD from three independent experiments. # indicates that the viral titers were below the detection thresholds. **, P < 0.01 indicate significant differences between the two samples
