Fig. 4.
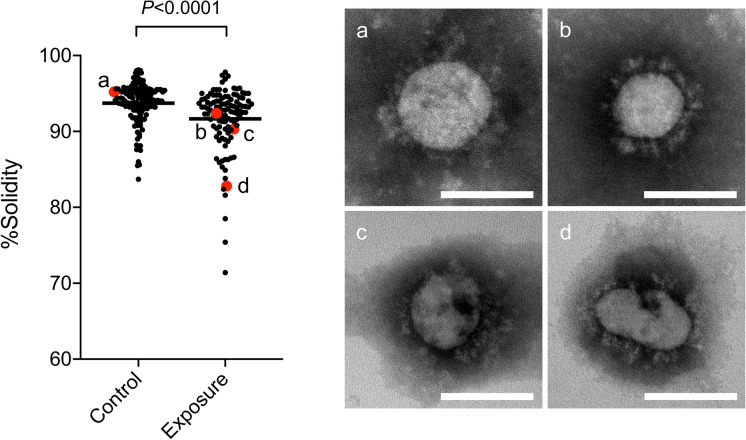
Analysis of viral morphology by TEM. Concentrated virus was treated with (exposure) or without (control) NEAWPs for 1 h. Samples were fixed and negative staining was performed. Digital images of particles of 60 to 80 nm in diameter were taken. The 114 particles in the exposure samples and 143 particles in the control samples from two independent experiments were analyzed for morphological distortion using the command ‘solidity’ in ImageJ software. Dots and horizontal bars denote the percentage solidity of each particle and the mean value, respectively. The viral particles in images (a) to (d) correspond with the dots (a) to (d) (in red on the graph). Scale bar, 100 nm

