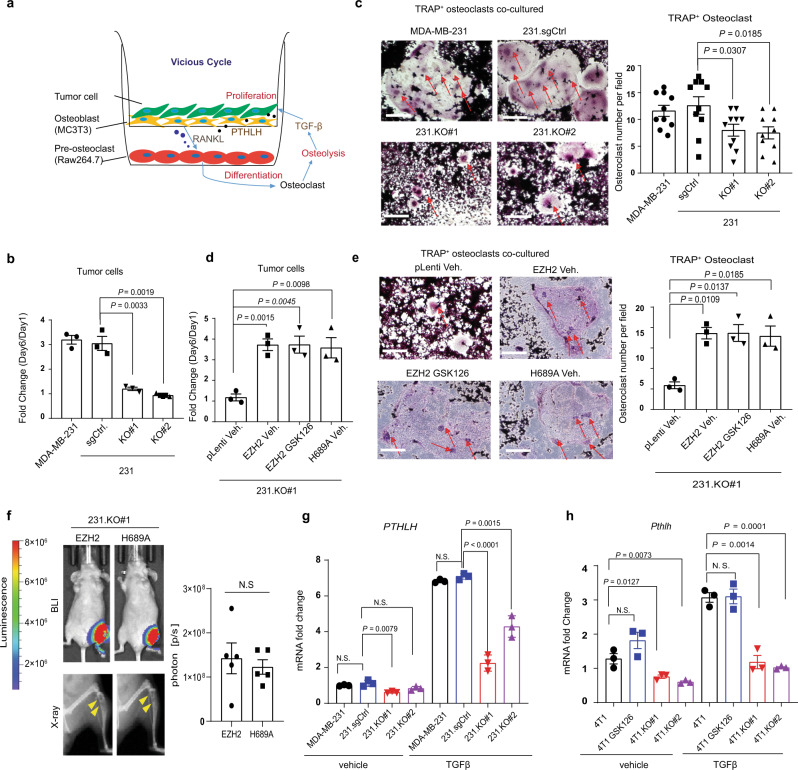
Fig. 2. EZH2 regulates the vicious cycle of breast cancer bone metastasis.
a Model of triple co-culture of breast cancer cells with preosteoclasts and osetoblasts. Murine RAW 264.7 preosteoclasts were seeded into the wells of six-well plates. GFP-labeled breast cancer cells and MC3T3 osteoblasts were seeded into Millicell Hanging Cell Culture Inserts (Millipore) in the six-well plates and treated with TGFβ (5 ng/mL). b Quantification of MDA-MB-231, 231.sgCtrl., 231.KO#1, and 231.KO#2 cells after co-culture with osteoclasts and MC3T3 osteoblasts treated with TGFβ (5 ng/mL) for 6 days. Data are presented as means ± S.E.M. t-test (two-sided). Three biologically independent experiments. c Representative staining images and quantification of mature TRAP+ osteoclasts after culture with MC3T3 osteoblasts and the indicated cancer cells, and treatment of them with TGFβ (5 ng/mL) for 6 days. The arrows indicate multinuclear mature TRAP+ osteoclasts. Scale bars, 200 μm. Data are presented as means ± S.E.M. t-test (two-sided). Ten random vision fields examined over three biologically independent experiments. d Quantification of 231.KO#1.pLenti. cells treated with vehicle, 231.KO#1.EZH2 cells treated with vehicle, 231.KO#1.EZH2 cells treated with 2 μM GSK126, 231.KO#1.H689A cells treated with vehicle, after co-culture with osteoclasts and MC3T3 osteoblasts treated with TGFβ (5 ng/mL) for 6 days. Data are presented as means ± S.E.M. t-test (two-sided). Three biologically independent experiments. e Representative staining images and quantification of mature TRAP+ osteoclasts after co-culture with MC3T3 osteoblasts and the indicated cancer cells and treatment of them with TGFβ (5 ng/mL) for 6 days. The arrows indicate multinuclear mature TRAP+ osteoclasts. Scale bars, 200 μm. Data are presented as means ± S.E.M. t-test, (two-sided). Three biologically independent experiments. f Representative bioluminescence image (BLI), X-ray images and quantification of BLI signals of bone-metastatic lesions in the two subgroups of mice (n = 5 in each group) intratibially injected with 231.KO#1.EZH2 or 231.KO#1.H689A cells 5 weeks post-injection. Data are presented as means ± S.E.M. t-test (two-sided). The arrows indicate osteolytic bone lesions in X-ray images. g qRT-PCR analysis of PTHLH mRNA expression in the indicated cells treated with a vehicle or TGFβ (5 ng/mL, 2 h). Data are presented as means ± S.E.M. t-test (two-sided). N.S. not significant. Three biologically independent experiments. h qRT-PCR analysis of Pthlh mRNA expression in the indicated cells treated with a vehicle or TGFβ (5 ng/mL, 2 h). Data are presented as means ± S.E.M. t-test (two-sided). Three biologically independent experiments. All P values are indicated in the figures. The TGFβ used in all experiments in this study is TGFβ1.

