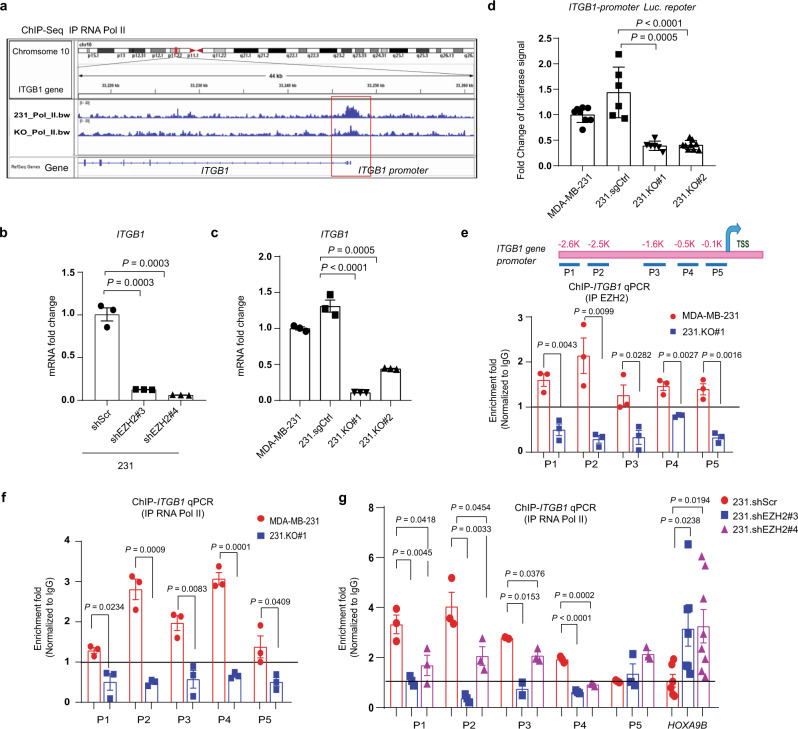
Fig. 5. EZH2 increases the FAK upstream ITGB1 expression.
a Screenshot of the RNA Pol II ChIP sequencing (ChIP-seq) signal (GSE188640) at the ITGB1 promoter locus in MDA-MB-231 (231_Pol _II.bw) and 231.KO#1 (KO_Pol_II.bw) cells. b qRT-PCR analysis of ITGB1 mRNA expression in the indicated cells. Data are presented as means ± S.E.M. t-test (two-sided). Three biologically independent experiments. c qRT-PCR analysis of ITGB1 mRNA expression in the indicated cells. Data are presented as means ± S.E.M. t-test (two-sided). Three biologically independent experiments. d ITGB1 promoter activity in MDA-MB-231, 231.sgCtrl, 231.KO#1, and 231.KO#2 cells as measured using a dual-luciferase reporter assay. ITGB1 firefly luciferase signal was divided by the control renilla luciferase signal, and the ratios of luciferase/renilla in four cell lines were normalized to that of MDA-MB-231 cells. n = 6 biologically independent experiments in 231.sgCtrl and 231.KO#1 cells; n = 8 biologically independent experiments in MDA-MB-231 cells, n = 9 biologically independent experiments in 231.KO#2 cells. Data are means ± SEM, t-test (two-sided). e Top: the locations of the primers at the ITGB1 gene promoter area for ChIP-qPCR. TSS, transcription start site. Bottom: EZH2 was immunoprecipitated from MDA-MB-231 and 231.KO#1 cells, and EZH2 binding to ITGB1 in the cells was detected using qPCR with the indicated primers. All fold-enrichment values were normalized according to IgG values. Three biologically independent experiments. Data are presented as means ± S.E.M. t-test (two-sided). f RNA Pol II was immunoprecipitated from MDA-MB-231 and 231.KO#1 cells, and RNA Pol II binding to ITGB1 in the cells was detected using qPCR with the indicated primers. All fold-enrichment values were normalized according to IgG values. Three biologically independent experiments. Data are presented as means ± S.E.M. t-test (two-sided). g RNA Pol II was immunoprecipitated from 231.shScr, 231.shEZH2#3, and 231.shEZH2#4 cells, and RNA Pol II binding to ITGB1 or HOXA9B in the cells was detected using qPCR with the indicated primers. HOXA9B was used as a negative control. All fold-enrichment values were normalized according to IgG values. Three biologically independent experiments using P1-P5 primers; six biologically independent experiments using HOXA9B primer. Data are presented as means ± S.E.M. t-test (two-sided). All P values are indicated in the figures.

