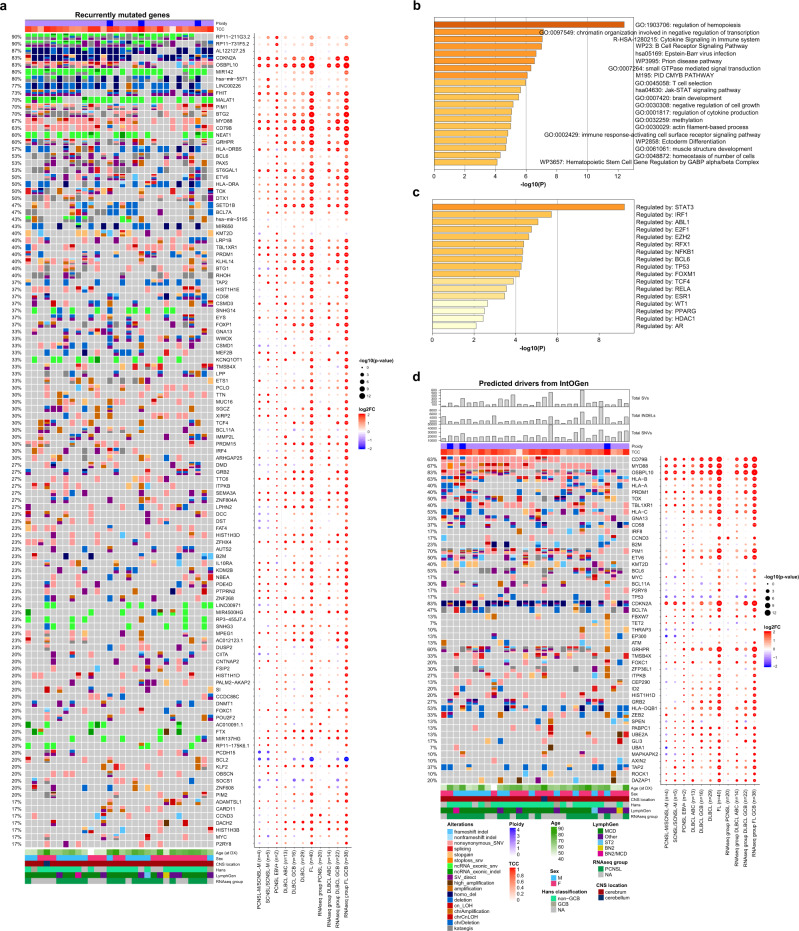
Fig. 2. Recurrent coding mutations and genomic drivers in PCNSL.
Oncoprints of recurrently mutated genes, excluding IG and chromosome Y genes (a). Mutated genes are listed from top to bottom depending on their alteration frequency. The corresponding dot plot reflects the log2 fold change and significance of alteration frequencies in the other subcohorts and RNAseq subgroups compared to PCNSL. The recurrently mutated genes (listed in the oncoprint in a) were analyzed by Metascape68 to identify pathway and process enrichment (b) and transcriptional regulatory networks (TRRUST) (c). Metascape adopts the hypergeometric test and employs the Benjamini-Hochberg correction for multiple testing. Oncoprints of driver genes in PCNSL (d). The top panel of the oncoprint shows the total numbers of structural variants (SVs), small insertions/deletions (INDELs), single nucleotide variants (SNVs), estimated ploidy, and genomic tumor cell content (TCC). Mutated genes are ranked by IntOGen. The corresponding dot plot reflects the log2 fold change and significance of alteration frequencies in the other subcohorts and RNAseq subgroups compared to PCNSL. In panels (a) and (d) the size of the dots demonstrate the significance according to a two-tailed Fisher’s exact test not corrected for multiple testing.

