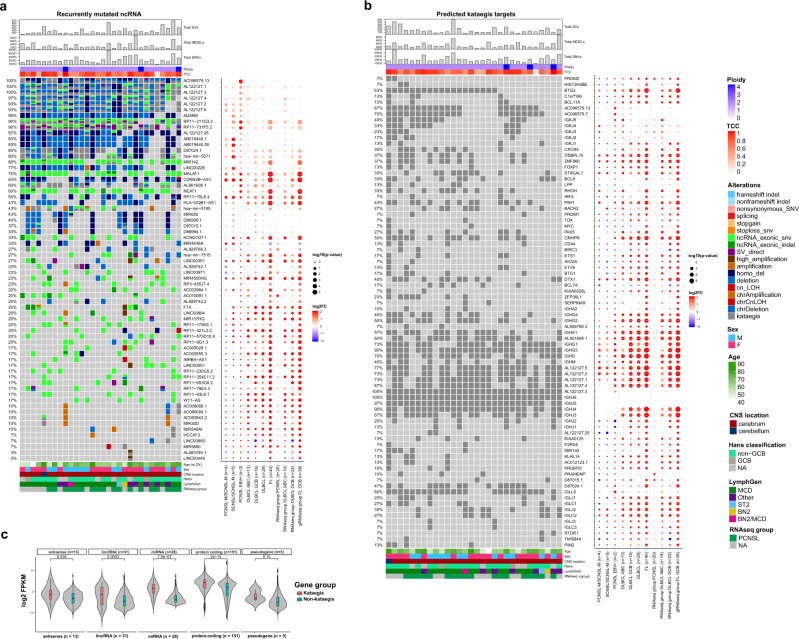
Fig. 3. Recurrent non-coding RNA mutations and Kataegis events in PCNSL.
Oncoprint of recurrent non-protein-coding genes in PCNSL (a). Shown are the total numbers of structural variants (SVs), small insertions/deletions (INDELs), single nucleotide variants (SNVs), estimated ploidy, and tumor cell content (TCC) (top panel). Mutated genes are listed from top to bottom depending on their alteration frequency. Oncoprint of recurrent kataegis events in PCNSL (b). Mutated genes are listed from top to bottom depending on chromosome location. The corresponding dot plot reflects the log2 fold change and significance of alteration frequencies in the other subcohorts and RNAseq subgroups compared to PCNSL. In panels a and b the size of the dots demonstrate the significance according to a two-tailed Fisher’s exact test not corrected for multiple testing. The violin plot c shows that the RNA expression of genes with kataegis loci compared to those without were significantly higher for antisense, long non-coding RNA, miRNA and protein coding genes (one-sided Wilcoxon rank sum test, p < 0.05). Box and whisker plots are embedded in the violin plots, showing median (center line), the upper and lower quartiles (the box), and the range of the data (the whiskers), excluding outliers.

