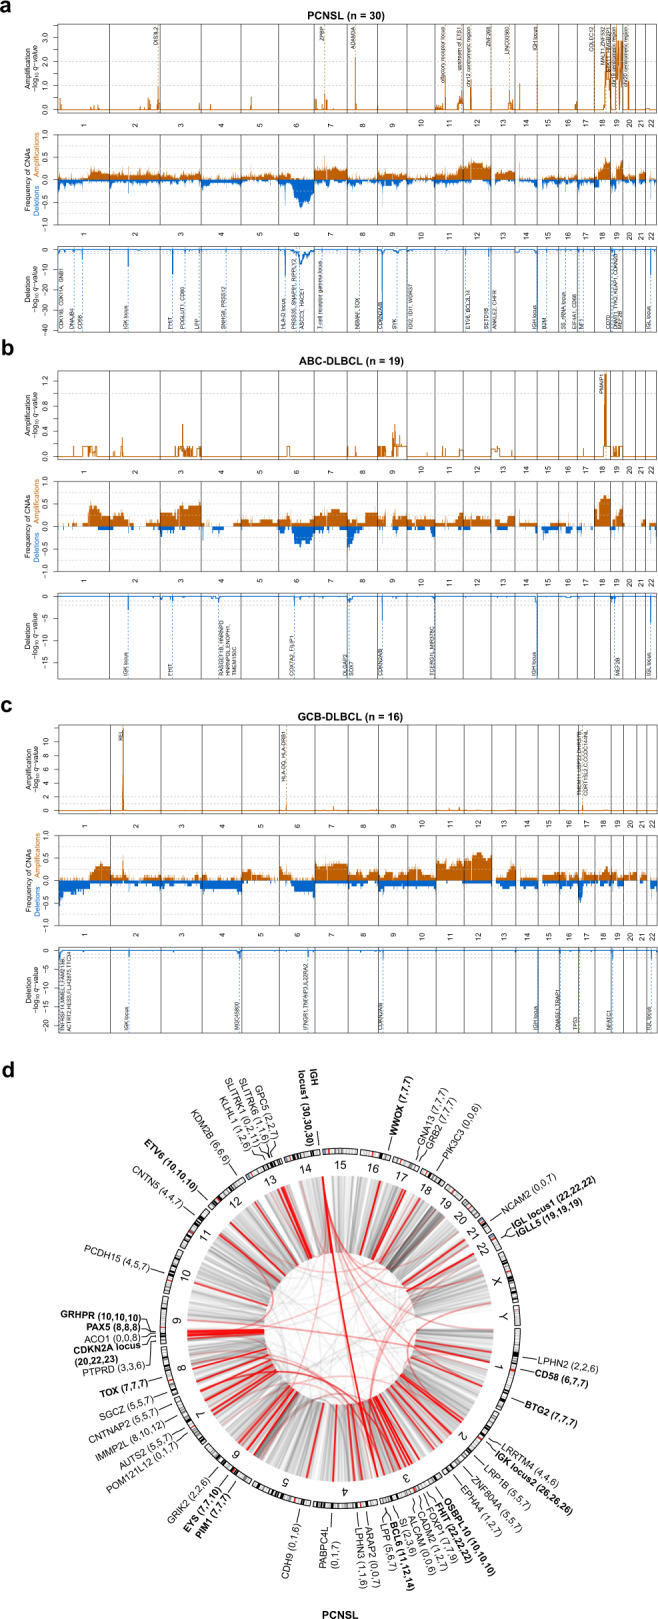
Fig. 4. Genomic structural variation in PCNSL.

Recurrent somatic CNAs in PCNSL (a), ABC-DLBCL (b), and GCB-DLBCL (c). Relative prevalence of somatic copy number aberrations in tumor samples (middle panel), showing the presence of at least one copy number gain (orange bars), copy number loss (blue bars), as a proportion of analyzed samples. Significantly (q-value < 0.25) amplified and deleted regions and candidate genes are shown (upper and lower panel). For GCB-DLBCL, we added TP53 as this was detected in a significant broad deletion (Gistic2 p-value 0.0311), and the focal peak falls on the region including TP53. Circular visualization of genome rearrangements in PCNSL (d). The panels (from outside going inwards) represent recurrence per gene, chromosome ideograms, and chromosome numbering. Next to gene names, the number of SV breakpoints that lie direct on the gene, within 100 kbp of the genes, and closest to that gene are reported. Inter-chromosomal translocations are rendered with black (all) and red (highlighted if affected in 20% of samples) arcs in the center of the display. The significance of CNVs was calculated using the GISTIC 2.0 permutation test with Benjamini–Hochberg correction for multiple testing.
