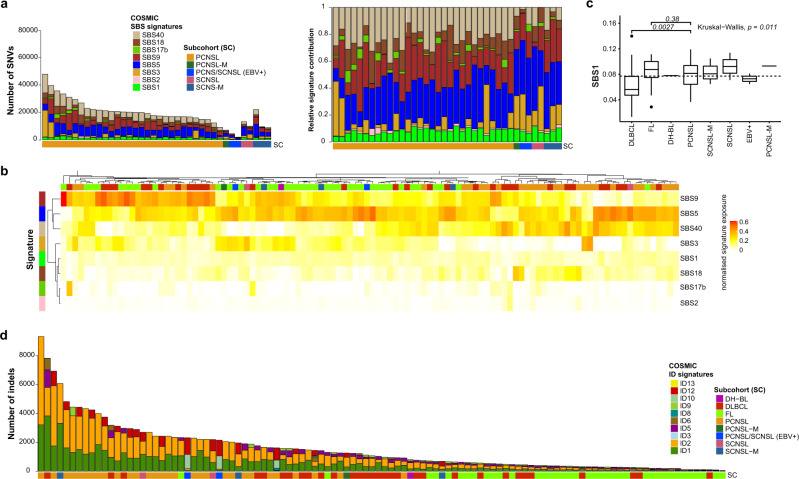
Fig. 6. Mutational signatures in PCNSL.
Single base substitution (SBS) signature contribution in PCNSL and SCNSL. Stacked bar plots are ordered by subgroup and then decreasing mutations load (a). The left bar plot shows the number of SNVs and the right shows the normalized signature exposures. Each color corresponds to a mutations signature and the proportion of the color reflects the number or proportion of SNVs explained by a certain mutational signature. The heatmap shows the clustering pattern of the SBS mutational signatures in all CNSL and peripheral lymphomas (b), which revealed groupings mutational signatures SBS5, SBS9, and SBS40. Pairwise comparison of PCNSL with DLBCL or FL (Mann–Whitney U test) revealed that signature SBS1 was significantly enriched in PCNSL compared to DLBCL (p = 0.027; c). Box and whisker plots show median (center line), the upper and lower quartiles (the box), and the range of the data (the whiskers), excluding outliers. Small insertion and deletion (ID) signatures in CNSL and peripheral lymphoma (d) demonstrate elevated numbers of indels and mutational patterns associated with slippage during DNA replication of the replicated DNA strand (ID1) and template DNA strand (ID2) in PCNSL.

