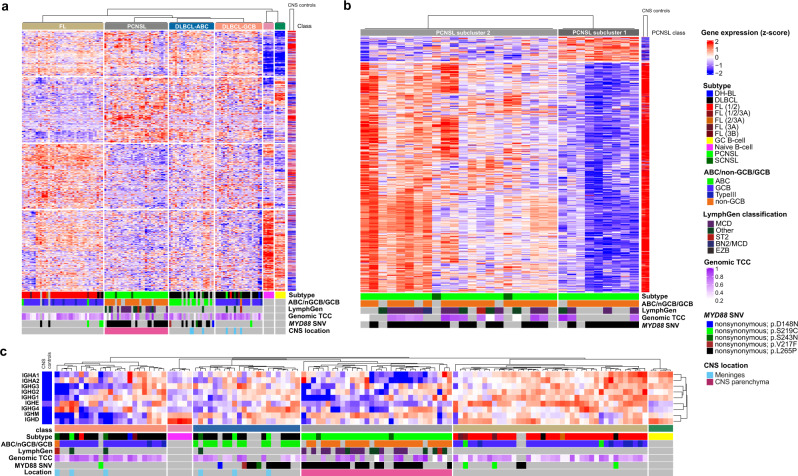
Fig. 7. Transcriptomic signatures distinguish PCNSL from DLBCL.
Global gene expression patterns clearly separate PCNSL from other subtypes (ABC-DLBCL, GCB-DLBCL, and FL; a). The heatmap shows unsupervised consensus clustering of gene expression data. All SCNSL-M and PCNSL-M cluster with non-CNS-DLBCL, distinct from intraparenchymal PCNSL. The ABC-DLBCL cluster is enriched for MYD88 mutant samples, which are distinct from MYD88 L265P mutant PCNSL. Samples of normal germinal center (GC) and naïve B-cells were included as controls. Furthermore, normal brain tissue (CNS controls) samples were added to analyze the impact of normal brain tissue contamination at the RNA level. Consensus clustering (skmeans) with intraparenchymal PCNSL samples and CNS controls revealed two groups (b). The first PCNSL expression group (PCNSL subcluster 1, on the right) consisted of samples with high tumor cell content, the second (PCNSL subcluster 2, on the left) contained mainly samples with a lower tumor cell content, which signatures correlated well with normal brain tissue expression. PCNSL can be distinguished from ABC-DLBCL, GCB-DLBCL, and FL based on the expression of IG constant genes (c).

