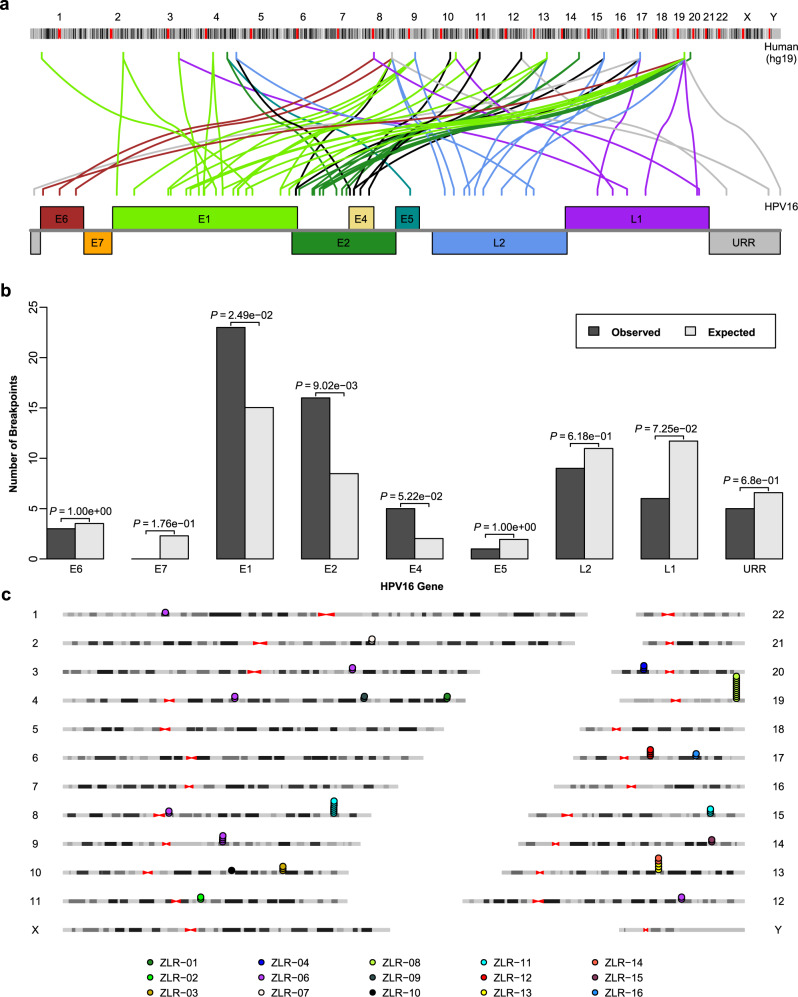
Fig. 1. Integration breakpoints detected in the human and HPV genomes.
a Distribution of integration breakpoints across human and virus genomes. The colored link line indicates which human chromosome and which virus gene the integration breakpoint had occurred on. Only HPV16-related breakpoints are shown. b Comparison of the observed and expected numbers of breakpoints in the viral genome. The expected number of breakpoints was calculated based on the assumption that breakpoints are uniformly distributed across the viral genome. Only HPV16-related breakpoints are shown (n = 61). P values were calculated by a two-sided binomial test. c Integration breakpoints are often clustered within the same sample in the human genome. Dots represent integration breakpoints and color keys indicate sample sources. Source data are provided as a Source Data file.

