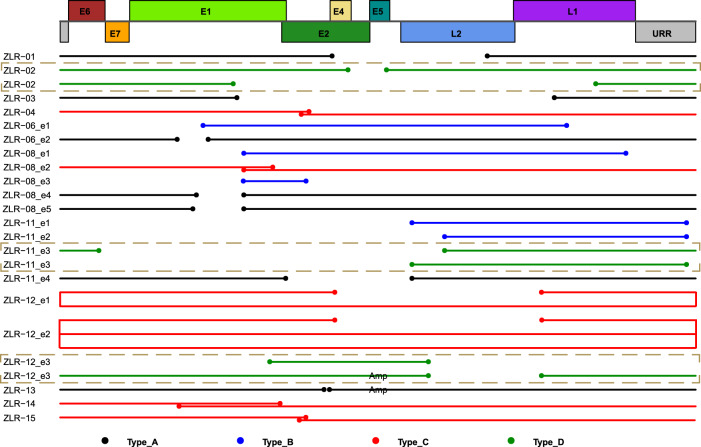
Fig. 3. Schematic representations of integrated HPV DNA fragment in each clonal integration event.
The top rectangles represent a schematic diagram of the linearized HPV16 genome structure. The solid lines below the virus genome represent the DNA fragment of HPV that was integrated into the human genome in each clonal integration event. The dot at the line end represents the breakpoint in the viral genome. The line/dot color represents a respective type of integrated HPV DNA segments as follows: Black, Type A; Blue, Type B; Red, Type C; and Green, Type D. The note of “Amp” on the lines indicates that these DNA fragments are amplified in the clonal integration event. If there was more than one event in a sample, a designation “en” is added after the sample name to distinguish these events, where n codes 1 to number of events. Only HPV16-related clonal integration events are shown. Source data are provided as a Source Data file.

