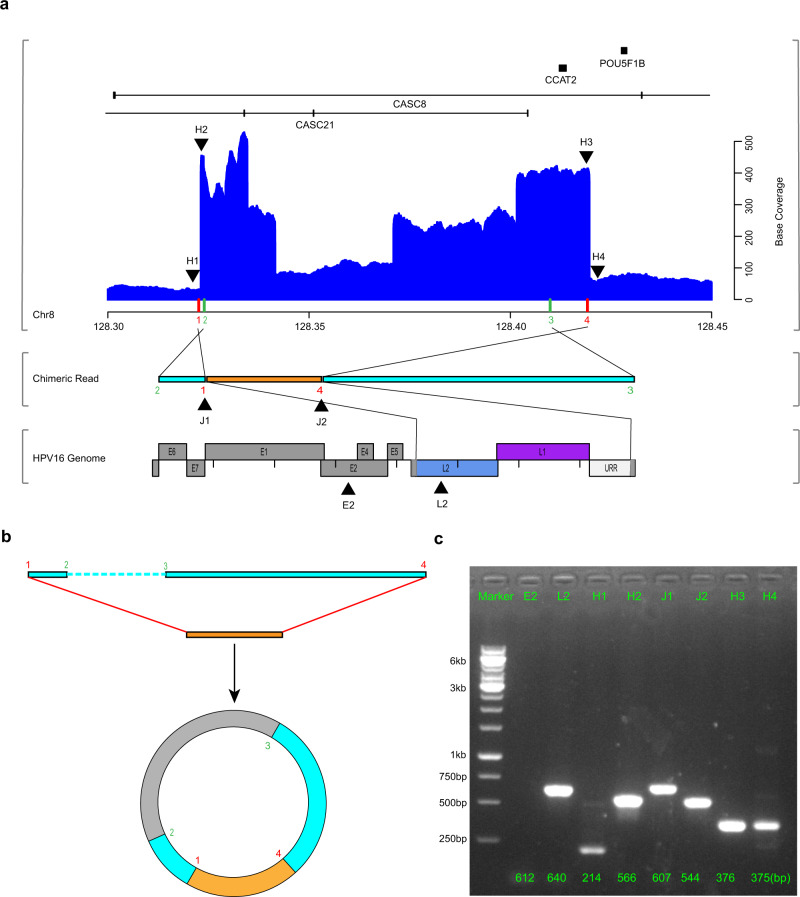
Fig. 5. Extrachromosomal circular virus-human DNA structures.
a A chimeric read (middle) from ZLR-11_e1 was mapped to both human (top) and HPV16 (bottom) genomes. In top panel, the blue histogram shows base coverage of regions of the human genome around HPV integration, with indicated chromosomal loci (down, x-axis in megabases) and corresponding gene schematics (up). On the x axis, red bars indicate the positions of HPV insertion breakpoints in the human genome and green bars indicate the positions of two endpoints of the observed chimeric read (middle). The colored Arabic numerals indicate the order of these breakpoints in the human genome, which indicates human-derived sequences on both sides of the chimeric read were in reversed orientations. The eight black triangles indicate the regions selected for PCR validation in c below. In bottom panel, the colored regions in the HPV16 genome represent the sequences contained in the integrated structure and gray regions represent the sequences that were replaced or lost due to integration. b Extrachromosomal circular virus-human DNA structure. The two ends of the integrated HPV DNA fragment (orange box) are connected with the human sequence on both sides (light blue box) to form an ECC DNA structure (not drawn to scale). The unobserved region (~86 kb) was indicated by gray in the circular structure. c PCR validation of amplification of eight selected regions in the clonal integration event ZLR-11_e1. Three independent experiments give similar results. IDs of the selected regions are indicated at the top. L2, H2, J1, J2, and H3 are five regions in the ECC DNA structure that are supposed to be amplified. E2, H1, and H4 are the control regions around the target amplification regions of HPV and human, respectively. The numbers at the bottom are the predicted PCR product sizes. Source data are provided as a Source Data file.

