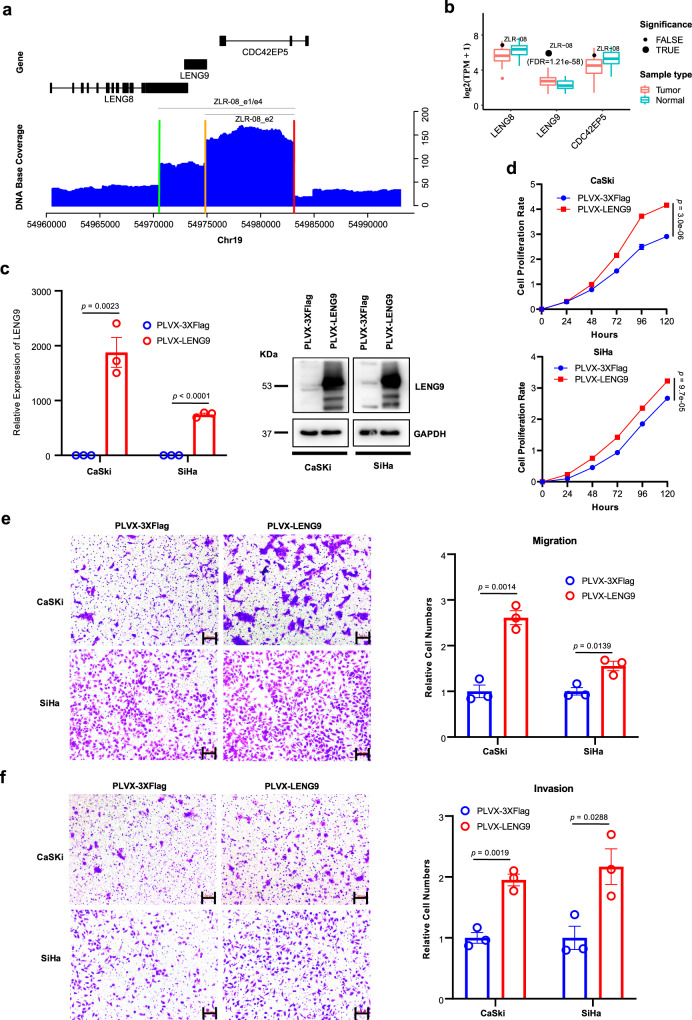
Fig. 6. Functional analysis of LENG9 in cervical cancer cell lines.
a DNA sequencing coverage depth around the target region involved in HPV integration. The blue histogram shows base coverage (y-axis) with indicated chromosomal loci (x axis) and corresponding gene schematics (top). Colored bars on the x axis indicate the positions of HPV insertion breakpoints in the human genome. Gray segments indicate the human genomic segments involved in integration events (target region). b Expression levels of three genes located in the target region in all tumors (n = 103) and adjacent normal samples (n = 39). Data are shown in boxplots. The thick line in the box is median and the box spans from Q1 (25th percentile) to Q3 (75th percentile). The whiskers extend to the most extreme observation within 1.5 times the interquartile range (IQR = Q3–Q1) from the nearest quartile. The gene expression level in ZLR-08 is highlighted by black dots. Significantly upregulated genes with adjusted p value < 0.05 are highlighted by dots of larger size. c The expression level of LENG9 was determined by qRT-PCR and western blot in cervical cancer lines CaSki and SiHa transfected with LENG9 overexpression or mock vector. Data are presented as mean values ± SEM (n = 3). d–f Proliferation, migration, and invasion assays of CaSki and SiHa transfected with LENG9 overexpression or mock vector. Scale bar, 100 μm. Quantification of migration and invasion cells was summarized as histograms. Data are presented as mean values ± SEM (n = 5 for proliferation assays and n = 3 for migration and invasion assays). Two sample t test was used for comparing the difference between overexpression and control groups. Source data are provided as a Source Data file.

