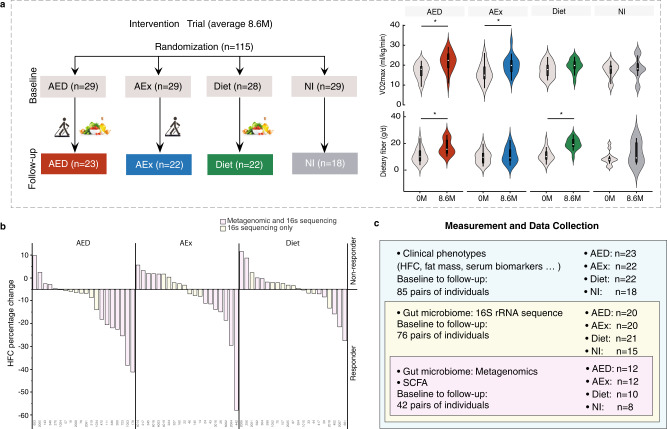
Fig. 1. Summary of clinical study.
a Study design. The measurements were performed before and after intervention, and comparison of dietary fiber intakes and estimated physical fitness indicated by VO2max before and after intervention are given. The white point, box range, line range and density plot width represent median, interquartile range, 95% confidient interval and frequence, respectively. AEx: aerobic exercise; AED: AEx+Diet; NI: no intervention. Comparisons within groups were performed using two-tailed paired t-test. *: Significance of p < 0.05. b Responders and low/non-responders according to change of HFC (the cutoff value was -5%) after intervention. AED: n = 20, AEx: n = 20, Diet: n = 21. c Data collection. Body fat mass was measured by DXA (dual X-ray densitometry); hepatic fat content (HFC) was determined by 1HMRS (proton magnetic resonance spectroscopy); fecal samples were collected for microbiome assessments with both 16 s rRNA and metagenome assessments; and blood samples were used for clinical biomarkers assessments.

