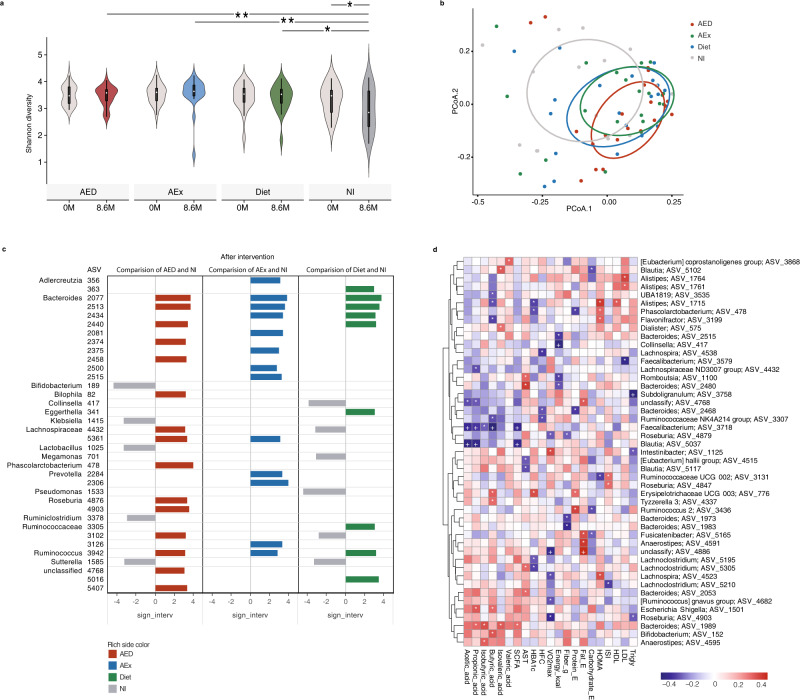
Fig. 2. Changes in the structure of gut microbiota before and after intervention and relationship of microbial abundance with clinical parameters.
a Alpha diversity (Shannon index) of gut microbiota was significantly decreased in the NI group by contrast to the intervention groups, which maintained their diversity after the intervention. The white point, box range, line range and density plot width represent median, interquartile range, 95% confidient interval and frequence, respectively. ANCOVA for repeated measures (2 factor interactions: group × time) and controlled for change of body weight, baseline value and intervention duration followed by Sidak correction for multiple comparison between the groups. Contrast results (K Matrix) were used to localize the group differences: *p < 0.05, by contrast to the NI group. AED 8.6 m vs NI 8.6 m, p = 0.011; AEx 8.6 m vs NI 8.6 m, p = 0.007; Diet 8.6 m vs NI 8.6 m, p= 0.025; NI 0 m vs NI 8.6 m, p = 0.031. AED: n = 20, AEx: n = 20, Diet: n = 21 and NI: n = 15. b Weighted Unifrac distance of samples was calculated from the QIIME 2 ASV level. Ellipsoids represent a 50% confidence interval surrounding each group. c Differential ASVs between the AED/AEx/Diet groups and NI group (LEfSe analysis, adjusted p < 0.05, log2 fold change > 2). Genus annotations on the left column covers multiple right ASVs. AED: n = 20, AEx: n = 20, Diet: n = 21 and NI: n = 15. d Heatmap of the Spearman’s correlation coefficients between change of ASVs as assessed by 16 S and clinical parameters independent of body weight and fat mass. Statistically significant coefficients are marked by * and +, which means p < 0.05 and FDR < 0.1respectively. Only ASVs with significant correlations (at least one based on p value) are shown.

