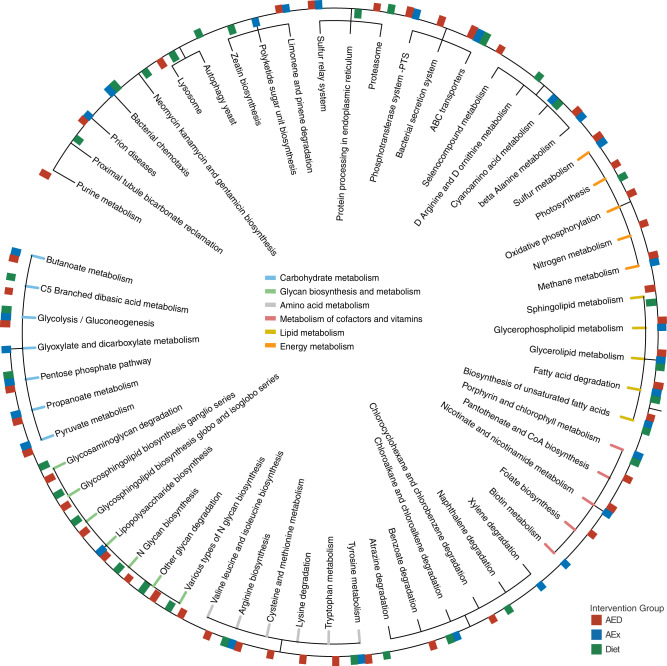
Fig. 3. Identified pathways by KEGG between intervention groups and NI group after intervention.
Only significant pathways with a linear discriminate analysis (LDA) score > 2.0 and p < 0.05 are shown. Six colors indicate six primary function pathways. The bars inside the circle indicate that 3 intervention groups had higher values than the NI group, and the bars outside the circle indicate that the intervention groups had lower values than the NI group. The bar length represents LDA score.

