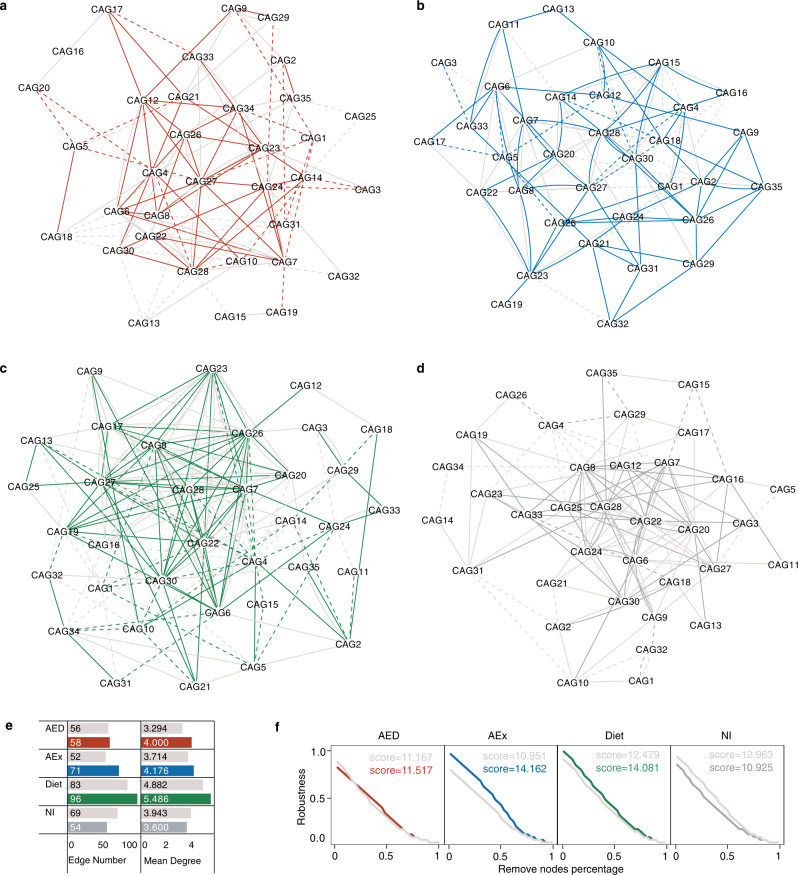
Fig. 4. Co-occurrence networks before and after intervention in paired participants.
a–d Co-occurrence networks of CAGs (co-abundance groups) before and after intervention in different groups (a: AED: n = 20; b: AEx: n = 20; c Diet : n = 21; d: NI: n = 15). The nodes represent CAGs and the edges represent statistically significant differences (p < 0.05) via Spearman correlation between CAGs without adjustment. The style of the edge is set to a dashed line and a solid line, which represent negative and positive correlation, respectively. Gray edges indicate correlation before intervention; colored edges indicate correlation after intervention. e Network connection properties. f Network robustness test.

