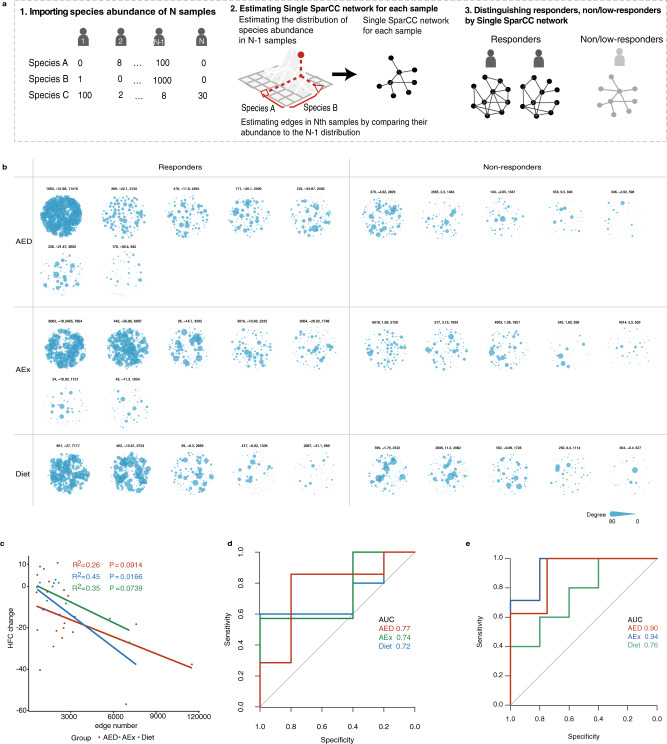
Fig. 5. Intervention efficiency predicted by individual baseline gut microbial networks on metagenomics species data.
a Prediction of responders using our single SparCC network method. b The gut microbial network for each individual before intervention based on metagenomics species data by the Single SparCC network method. Three numbers under every network represent subject ID, HFC change and edge numbers. c Linear regressions of edge number (Single SparCC network) with the change of HFC after intervention. AED: n = 12, AEx: n = 12, Diet: n = 10. d ROC curve of edge number for differential responders from low/non-responders within each intervention group by unsupervised classification. AED: n = 12, AEx: n = 12, Diet: n = 10. e ROC curve by supervised Lasso model performance. AED: n = 12, AEx: n = 12, Diet: n = 10.

