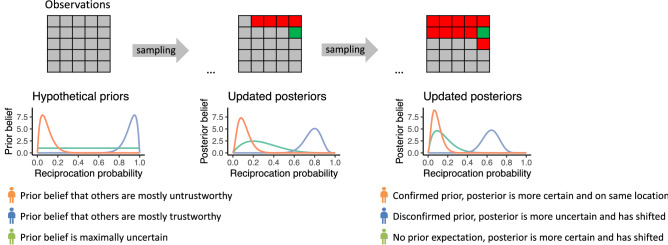
Figure 1.
Illustration of how prior belief distributions update to posterior beliefs. The grid represents sampled information about trustworthiness. A green tile indicates that the sample resulted in an observation of trustworthiness, red tiles represent observations of untrustworthiness, and grey tiles are not sampled. At the start all tiles are grey as no samples have been drawn yet and therefore the current belief distribution about trustworthiness is the prior belief distribution. The belief distributions update with each sample. The orange, green and blue lines in the plots represent three hypothetical subjects’ prior belief distributions and their corresponding, updated posterior belief distribution. The updated posteriors belief distributions in the middle reflect an intermediate belief stage when there are 4 red and 1 green tile. The updated posterior belief distributions on the right reflect the scenario where even more samples were drawn (10 red and 1 green tile). These three hypothetical subjects were selected to illustrate that the posterior beliefs can be quite different depending on the prior expectation (mean) and the prior uncertainty (variance) of the prior belief distribution. The orange prior distribution reflects the expectation that lower reciprocation probabilities are more likely. The observed outcomes match that prior expectation. The posterior uncertainty therefore decreases but the posterior mean does not update. The blue prior distribution reflects a belief that higher reciprocation probabilities are more likely. The sample outcomes disconfirm this belief and the posterior belief therefore shows a large update (a shift in the mean) and becomes more uncertain (higher variance). The green prior distribution has a maximal uncertainty, i.e., a belief that all reciprocation probabilities are equally likely. The posterior belief shows both a large update and reduced uncertainty.

