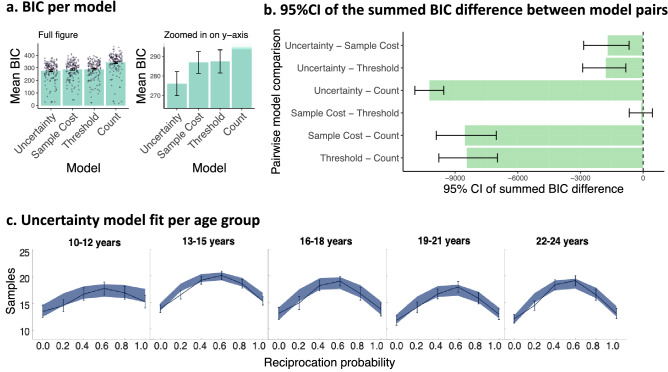
Figure 3.
Model fit results. (a) The Bayesian Information Criterion (BIC) per model, averaged over participants (bars depict the mean and error bars show the s.e.m). Dots show individual BIC scores. Lower BIC values indicate a better fit, thus showing that the Uncertainty model fits best. BIC scores were computed for each participant and each model. The left panel is the full figure, while the panel on the right is zoomed in as the count model fitted much less well than the other models. (b) 95% confidence intervals (CI) of the summed BIC difference between models. Zero indicates no difference between models. Negative values are in favour of the model before the subtraction sign, as lower BIC indicates a better fit. The Uncertainty model fits significantly better than the Sample Cost and Threshold models (95% CI does not contain zero). The BIC scores of a model pair were subtracted from each other for each participant, thereby obtaining one difference score per participant for each model pair. To assess significance, the 95% confidence interval of the BIC difference was computed using bootstrapping with 105 iterations. (c) Alignment between the uncertainty model predictions and behavioural data across age. Age is grouped for visualization purposes. The shaded area is the s.e.m. of the data that was simulated with the participants’ estimated parameters in the Uncertainty model. The line graph represents the mean and s.e.m. of the participants’ actual data. The overlap between the shaded area and line graphs show that the Uncertainty model fitted well for each age group.

