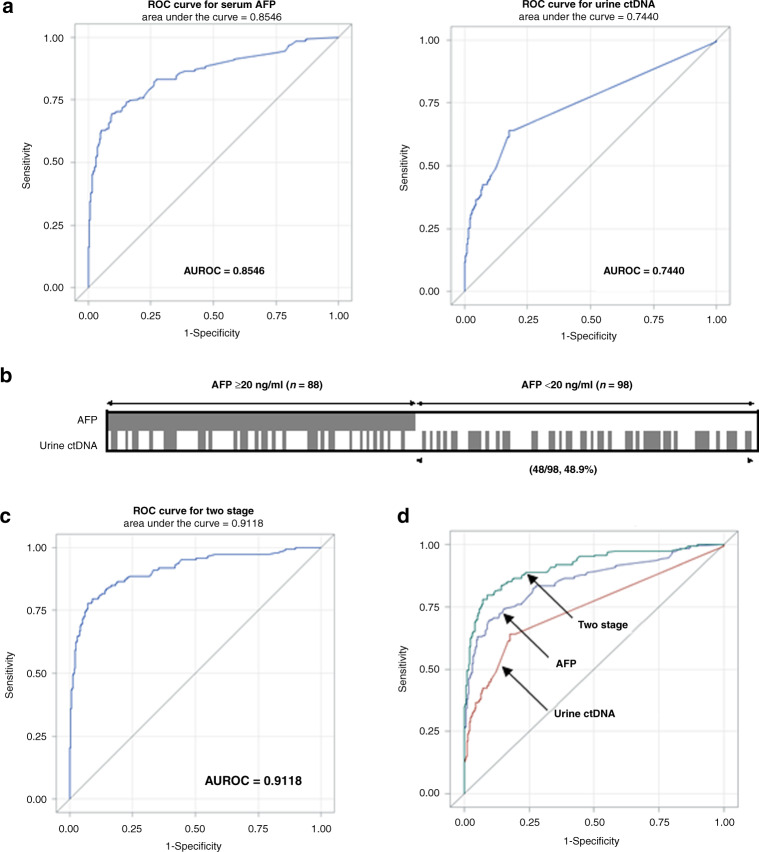
Fig. 3. Performance of urine ctDNA markers for distinguishing HCC from non-HCC.
a Receiver-operating curves (ROC) of serum AFP alone and urine ctDNA markers alone. b Distribution of patients stratified by AFP cut-off of 20 ng/mL. The marker values are summarised in Supplemental Table 5. Each box represents a patient sample, and those with positive urine ctDNA biomarker detection are filled, based on the cut-off set at 90% specificity. AFP was positive (≥20 ng/mL) in 47.3% (88/186) of all HCC cases. Urine ctDNA panel was positive in 44.1% (82/186) of all HCC cases which included 48.9% (48/98) of the low AFP (<20 ng/mL) HCC group. c ROC of the two-stage model. d Comparison of three ROC curves as indicated.

