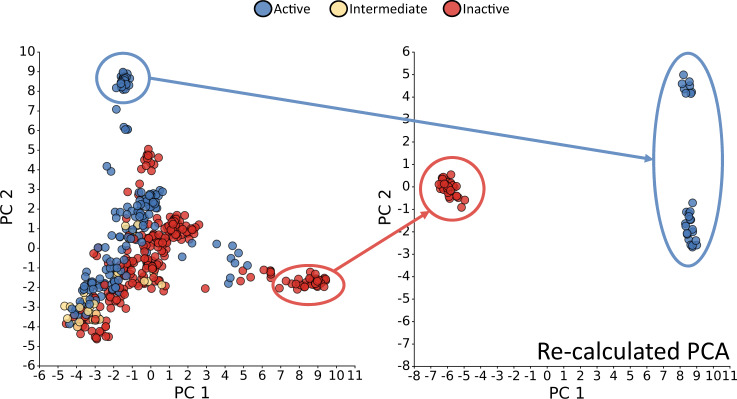
Fig. 2. Plot of the first two principal components (PCs) of the residue contact analysis for class A structures.
Each point represents a PDB structure. They are coloured according to the GPCRdb classification into active (blue), intermediate (yellow), and inactive (red)16. The right panel shows the data re-calculated based on the points in the clearly separated active and inactive clusters. Each principal component (PC) value for each PDB can be seen as a linear combination of variables (i.e. contacts) that represents the residue contact landscape of a structure in a condensed manner. The first two PCs shown here explained most of the variance across all structural data, hence represent the most interesting PCs for investigating differences between receptor states on the residue contact level. Source data are provided as a source_data.xlsx file.

